> ## Documentation Index
> Fetch the complete documentation index at: https://docs.nebuly.com/llms.txt
> Use this file to discover all available pages before exploring further.
# Explore mode
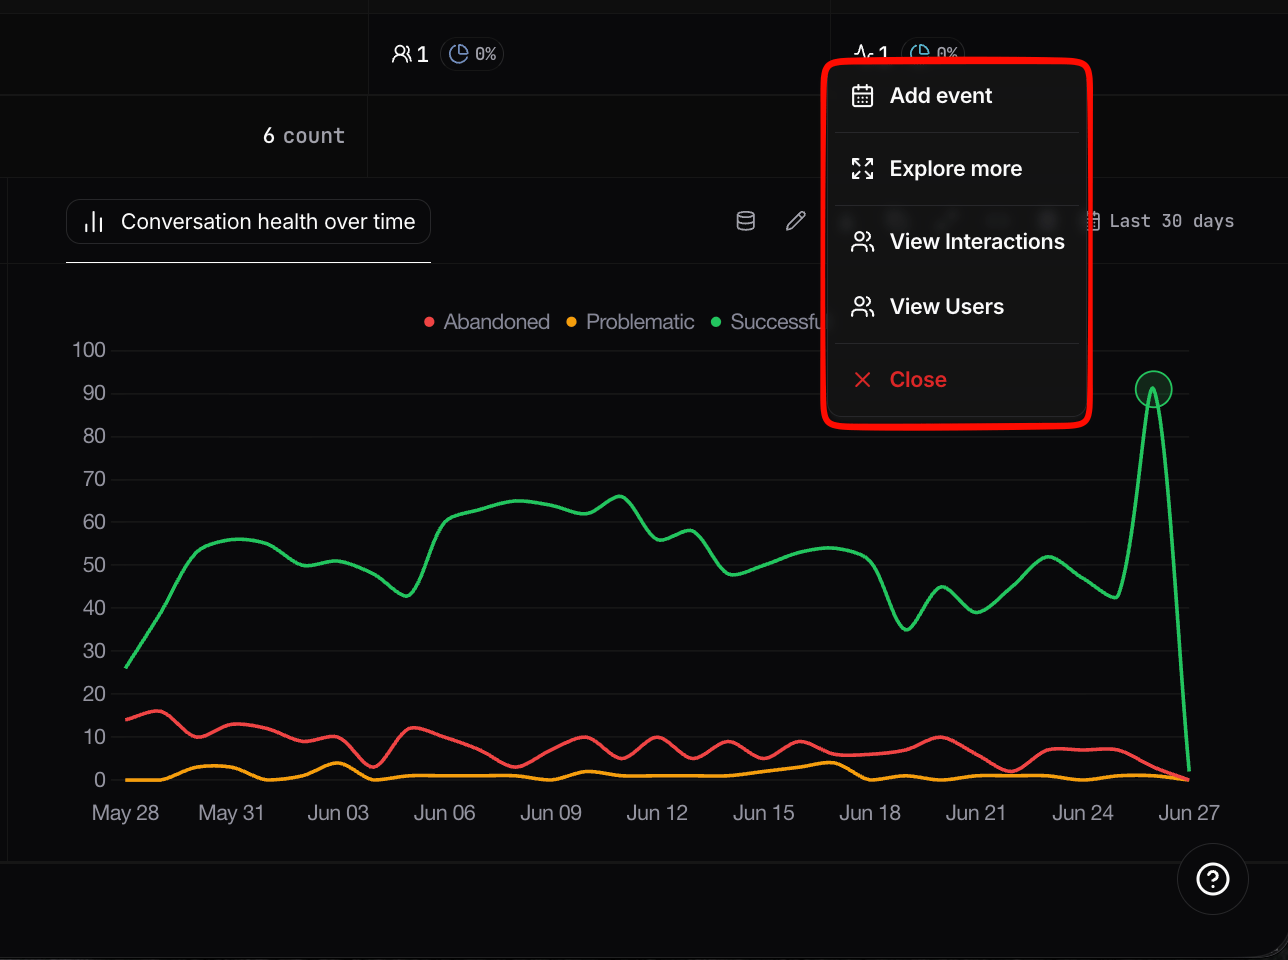
Every data point on a chart is a live entry point into the records behind it. **Right-click any point** on a chart (a peak in conversation health, a spike in error rate, a bar in a breakdown) and a context menu opens with options to drill straight into the underlying data:
* **View Interactions**: open the exact interactions that make up that data point. Read more about interactions [here](/guides/live-data/interactions).
* **View Users**: open the users implicated in that data point. Read more about users [here](/guides/live-data/users).
* **Add event**: annotate that moment on the timeline. Read more about events [here](/guides/setup/events).
* **Explore more:** Open the selected data point in **Explore Mode** to drill down into the underlying classes, interactions, and conversations.
**Explore mode turns any chart from a static summary into an investigation tool.** When you spot something unusual, you are one click away from the specific conversations, users, and interactions responsible, with the chart's current filters and time range carried over.
 ## How It Works
**Explore Mode** lets you move seamlessly from high-level analytics to the underlying data behind every chart.
With Explore Mode, you can:
* Drill down from aggregated metrics into lower levels of detail.
* Navigate between classes, users, interactions, and conversations.
* Continue refining your analysis using filters without rebuilding your reports.
Open Explore Mode from a chart's **Explore** action or directly from a report table. Nebuly automatically preserves your current report, chart, and active filters, so you always continue your investigation with the same context.
As you drill down, use the **Explore breadcrumb** at the top of the page to easily navigate between levels. The breadcrumb shows your current path through the data and lets you move back and forth between classes, interactions, users, and conversations with a single click.
## How It Works
**Explore Mode** lets you move seamlessly from high-level analytics to the underlying data behind every chart.
With Explore Mode, you can:
* Drill down from aggregated metrics into lower levels of detail.
* Navigate between classes, users, interactions, and conversations.
* Continue refining your analysis using filters without rebuilding your reports.
Open Explore Mode from a chart's **Explore** action or directly from a report table. Nebuly automatically preserves your current report, chart, and active filters, so you always continue your investigation with the same context.
As you drill down, use the **Explore breadcrumb** at the top of the page to easily navigate between levels. The breadcrumb shows your current path through the data and lets you move back and forth between classes, interactions, users, and conversations with a single click.
 ## Explore Actions
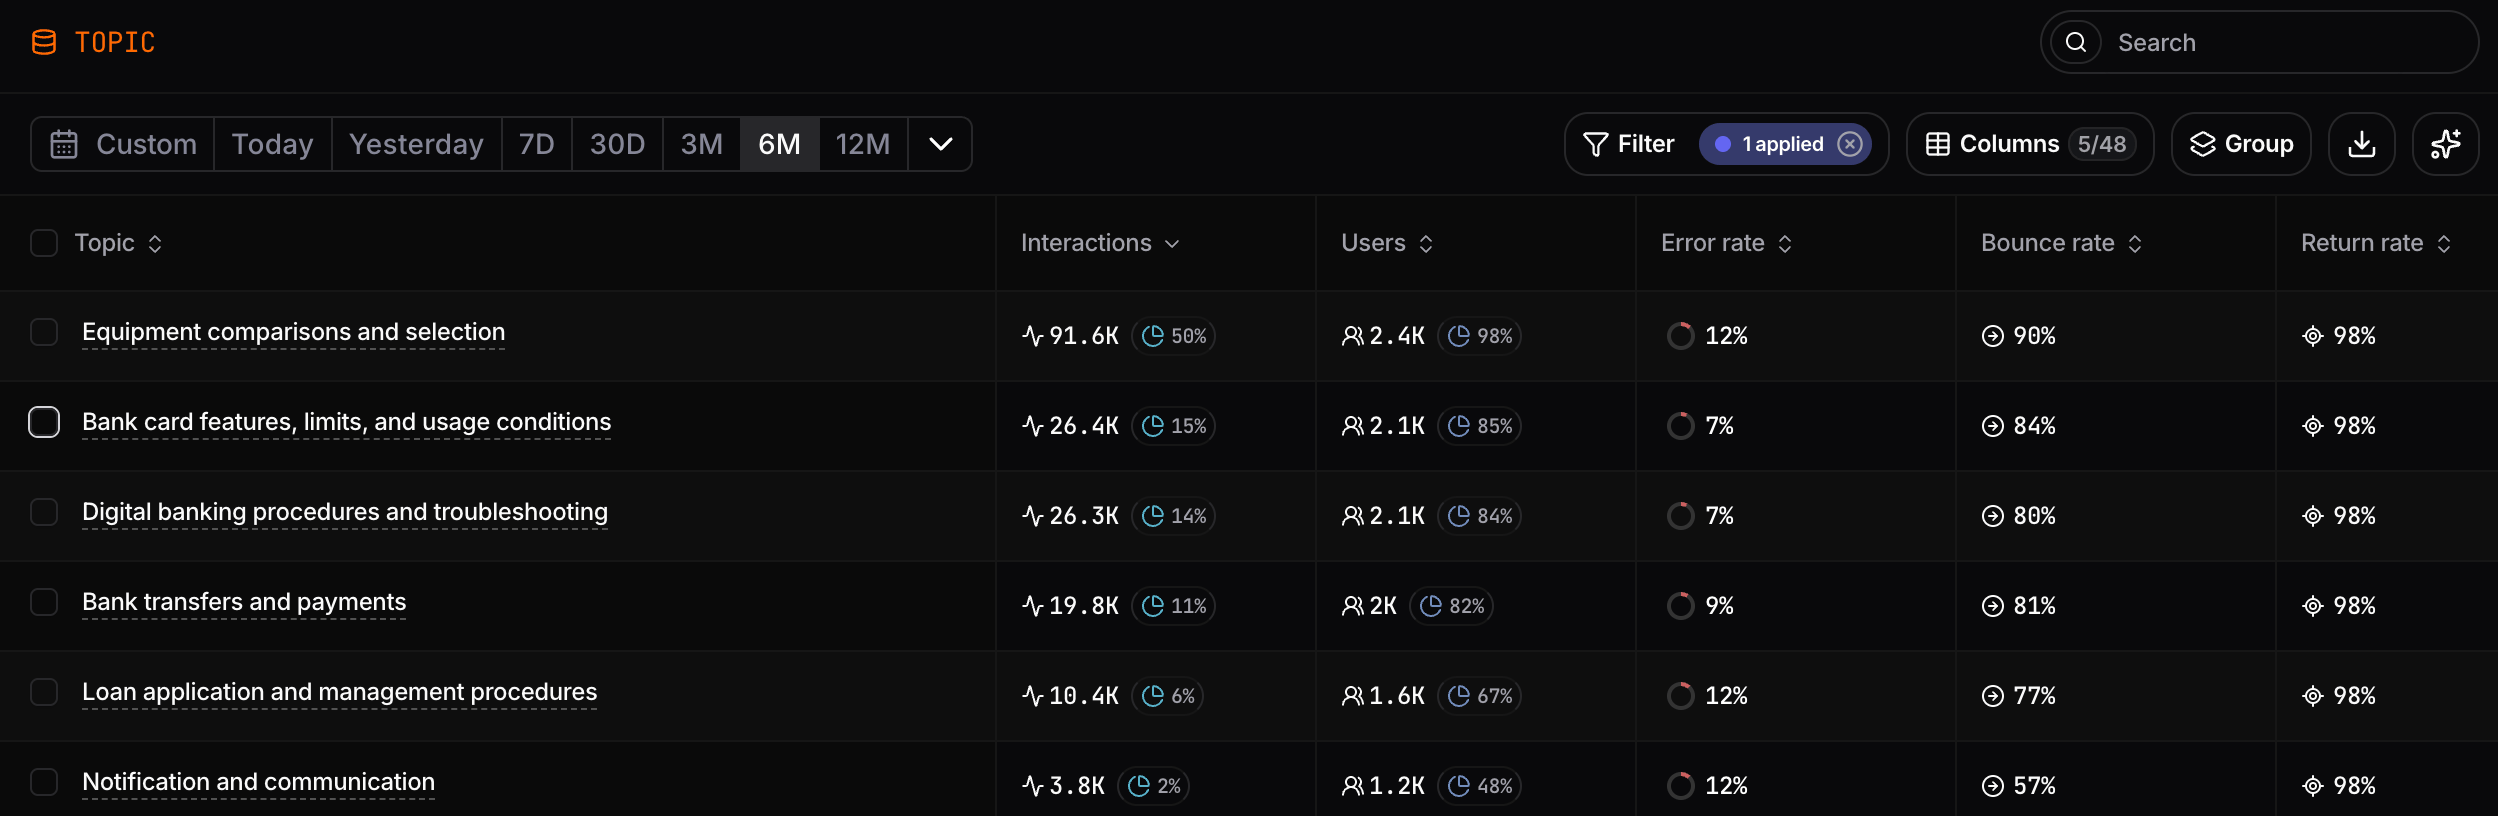
Nebuly's taxonomy is fully editable, allowing you to continuously refine how conversations are categorized as your AI application evolves. To learn more about taxonomies, read [here](/guides/setup/taxonomy).
While in Explore mode, you can perform the following actions:
#### Rename classes
Rename a class to better reflect your business terminology. Renaming only changes the label—all conversations, users, and historical analytics remain unchanged.
#### Merge classes
Merge two or more classes into a single one. The new class inherits all conversations, users, interactions, and historical analytics from the original classes, preserving your reporting history while simplifying your taxonomy.
#### Delete classes
Delete classes that are no longer relevant. Historical conversations are preserved and can be reclassified into other classes if needed.
Alternatively, if you want to mention selecting multiple classes without making it an action:
To merge or delete multiple classes at once, simply select them from the table and choose the desired action. This makes it easy to reorganize large taxonomies in bulk.
## Explore Actions
Nebuly's taxonomy is fully editable, allowing you to continuously refine how conversations are categorized as your AI application evolves. To learn more about taxonomies, read [here](/guides/setup/taxonomy).
While in Explore mode, you can perform the following actions:
#### Rename classes
Rename a class to better reflect your business terminology. Renaming only changes the label—all conversations, users, and historical analytics remain unchanged.
#### Merge classes
Merge two or more classes into a single one. The new class inherits all conversations, users, interactions, and historical analytics from the original classes, preserving your reporting history while simplifying your taxonomy.
#### Delete classes
Delete classes that are no longer relevant. Historical conversations are preserved and can be reclassified into other classes if needed.
Alternatively, if you want to mention selecting multiple classes without making it an action:
To merge or delete multiple classes at once, simply select them from the table and choose the desired action. This makes it easy to reorganize large taxonomies in bulk.