> ## Documentation Index
> Fetch the complete documentation index at: https://docs.nebuly.com/llms.txt
> Use this file to discover all available pages before exploring further.
# Alerting
> Get notified in Slack or Microsoft Teams when a metric crosses a threshold, or on a recurring schedule.
Alerting keeps you informed about what's happening in your AI deployment without having to watch dashboards. You set the conditions you care about, and Nebuly notifies your team in Slack or Microsoft Teams when they happen, or on a regular schedule.
## What it does
There are two kinds of alerts:
* **Threshold alerts**: fire a notification when a metric crosses a value you define (e.g. error rate goes above `5%`).
* **Recurring summaries**: send a periodic digest of a project's activity on a schedule you choose.
Notifications are delivered through **Slack** or **Microsoft Teams** incoming webhooks. (Email support is planned for later.)
 ## Where to manage alerts
All alerts live under **Settings → Alerts**. From there you can see every alert configured for the organization and create, edit, or delete them.
Each delivered notification is also recorded in a notifications table, where the date column is labelled `Started on {date}` so you can see exactly when each one fired.
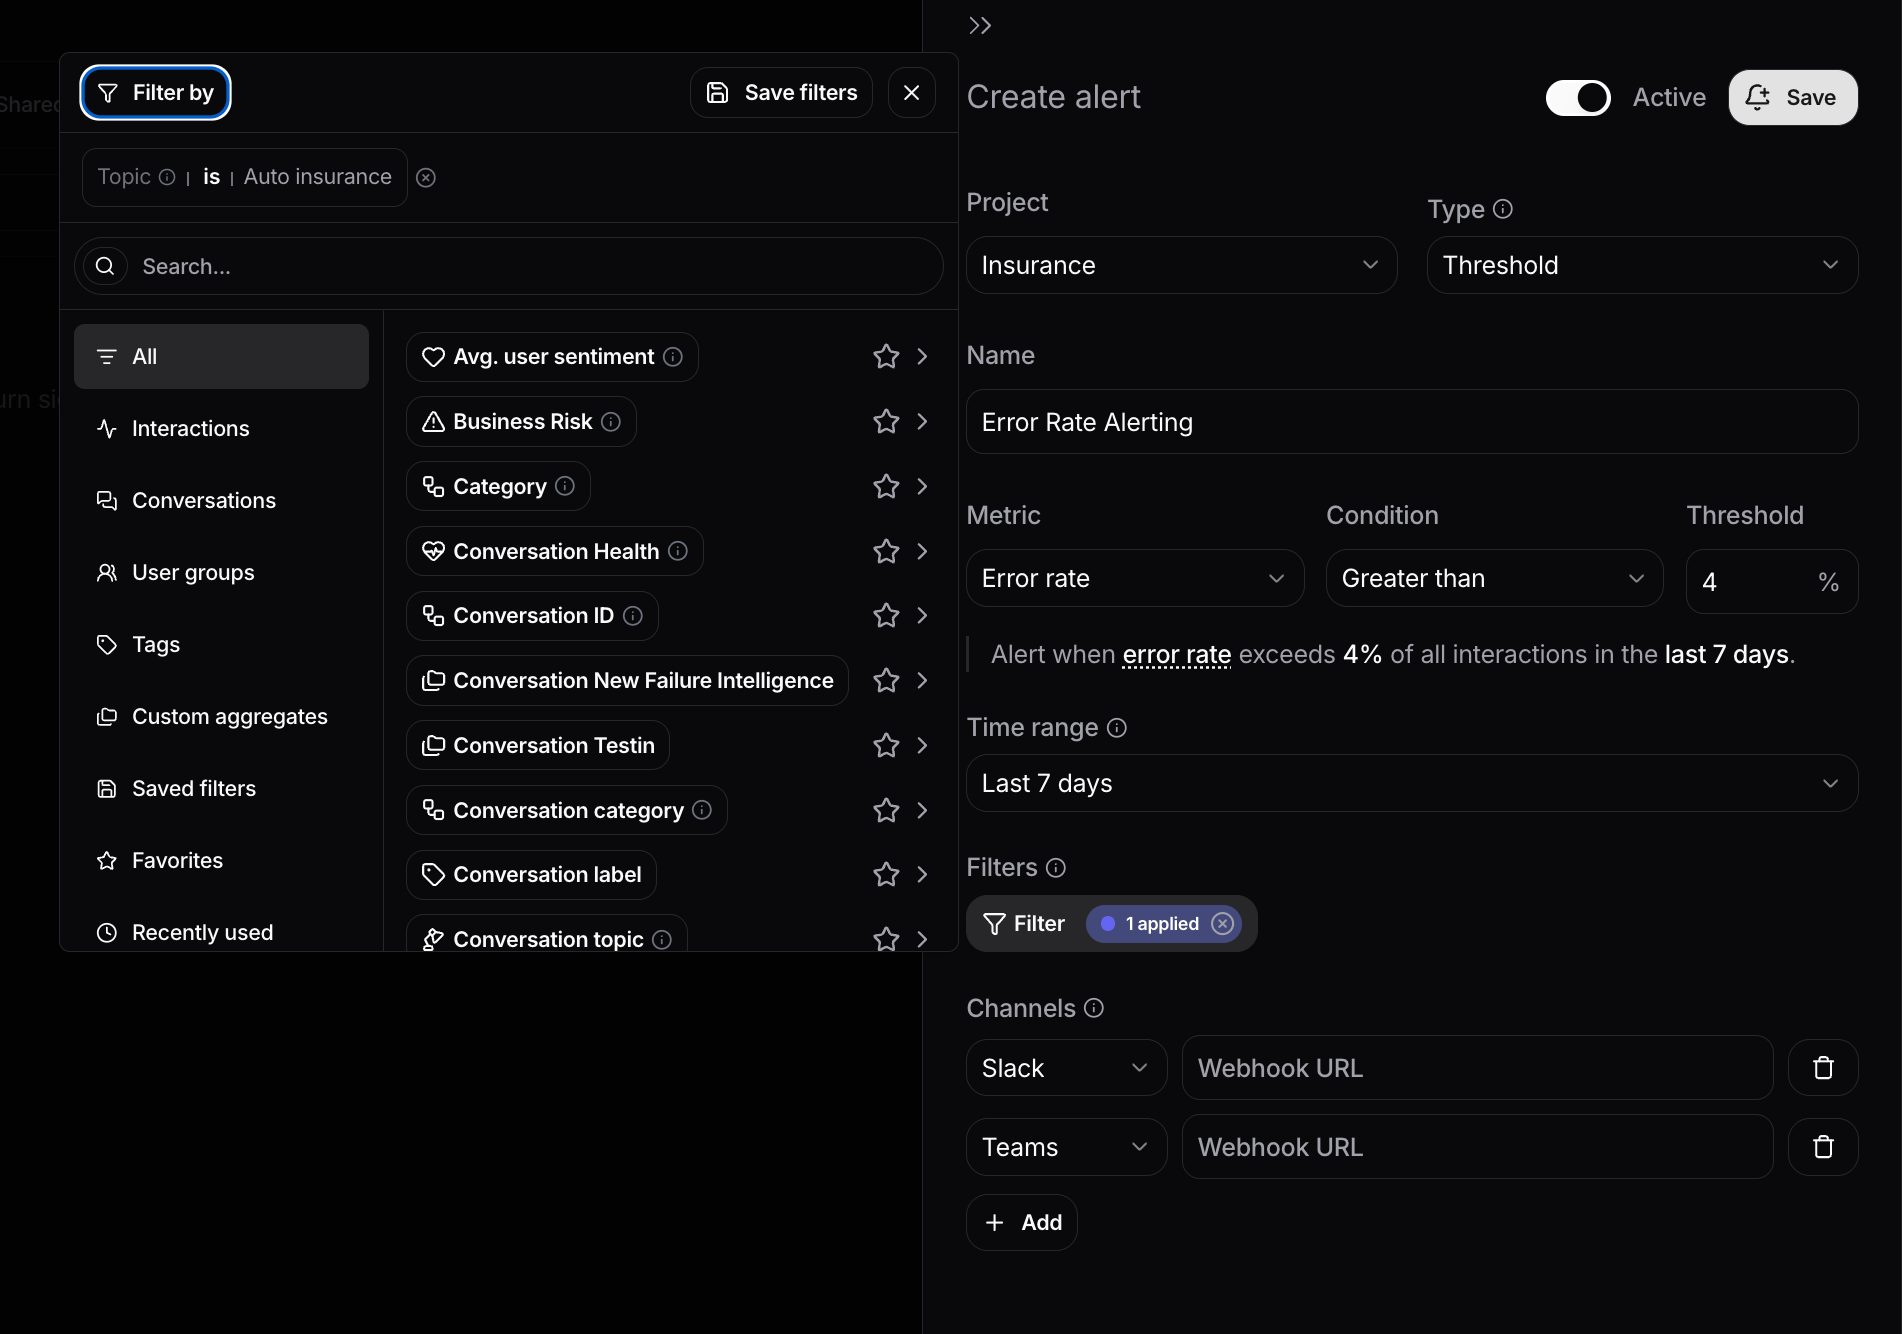
## Threshold alerts
A threshold alert watches one metric and notifies you when it crosses your limit.
**1. Choose the metric.** Options are:
| Metric | What it tracks |
| ------------------------ | ----------------------------------------------------- |
| **Error Rate** | Share of interactions with an error |
| **Interactions (Count)** | Number of interactions |
| **Users (Count)** | Number of users |
| **Topic** | Volume of selected topics, as a count or a percentage |
**2. Set the condition.** Choose **greater than** or **less than** and enter the threshold. The input adapts to the metric:
* **Error Rate** and **Topic (percentage)**: entered as a percentage.
* **Interactions**, **Users**, and **Topic (count)**: entered as an absolute number.
**3. Choose the time window.** Last **24 hours**, **7 days**, or **30 days**.
**4. Optionally add filters** to narrow what the alert looks at. You can filter by **topics**, **failure type**, **business risk**, and **tags**.
Threshold alerts are **edge-triggered**: you are notified once, at the moment the threshold is crossed, rather than repeatedly for as long as the condition stays true. You will be notified again only when it crosses back and then breaches again.
## Recurring summaries
A recurring summary is a scheduled digest of a project's activity. You pick:
* **The schedule**: **daily** or **weekly**.
* **The start date and time** the digest should begin from.
It then arrives automatically on that cadence, giving the team a regular snapshot without anyone having to pull it manually.
## Setting up delivery
Alerts are sent to a Slack or Teams channel via an **incoming webhook**, which you create once in the destination tool and paste into Nebuly:
* **Slack**: [Sending messages using incoming webhooks](https://docs.slack.dev/messaging/sending-messages-using-incoming-webhooks/)
* **Microsoft Teams**: [Send messages in Teams using incoming webhooks](https://support.microsoft.com/en-us/office/send-messages-in-teams-using-incoming-webhooks-323660ec-12ca-40b1-a1d3-a3df47e808c4)
## Where to manage alerts
All alerts live under **Settings → Alerts**. From there you can see every alert configured for the organization and create, edit, or delete them.
Each delivered notification is also recorded in a notifications table, where the date column is labelled `Started on {date}` so you can see exactly when each one fired.
## Threshold alerts
A threshold alert watches one metric and notifies you when it crosses your limit.
**1. Choose the metric.** Options are:
| Metric | What it tracks |
| ------------------------ | ----------------------------------------------------- |
| **Error Rate** | Share of interactions with an error |
| **Interactions (Count)** | Number of interactions |
| **Users (Count)** | Number of users |
| **Topic** | Volume of selected topics, as a count or a percentage |
**2. Set the condition.** Choose **greater than** or **less than** and enter the threshold. The input adapts to the metric:
* **Error Rate** and **Topic (percentage)**: entered as a percentage.
* **Interactions**, **Users**, and **Topic (count)**: entered as an absolute number.
**3. Choose the time window.** Last **24 hours**, **7 days**, or **30 days**.
**4. Optionally add filters** to narrow what the alert looks at. You can filter by **topics**, **failure type**, **business risk**, and **tags**.
Threshold alerts are **edge-triggered**: you are notified once, at the moment the threshold is crossed, rather than repeatedly for as long as the condition stays true. You will be notified again only when it crosses back and then breaches again.
## Recurring summaries
A recurring summary is a scheduled digest of a project's activity. You pick:
* **The schedule**: **daily** or **weekly**.
* **The start date and time** the digest should begin from.
It then arrives automatically on that cadence, giving the team a regular snapshot without anyone having to pull it manually.
## Setting up delivery
Alerts are sent to a Slack or Teams channel via an **incoming webhook**, which you create once in the destination tool and paste into Nebuly:
* **Slack**: [Sending messages using incoming webhooks](https://docs.slack.dev/messaging/sending-messages-using-incoming-webhooks/)
* **Microsoft Teams**: [Send messages in Teams using incoming webhooks](https://support.microsoft.com/en-us/office/send-messages-in-teams-using-incoming-webhooks-323660ec-12ca-40b1-a1d3-a3df47e808c4)