> ## Documentation Index
> Fetch the complete documentation index at: https://docs.nebuly.com/llms.txt
> Use this file to discover all available pages before exploring further.
# Business risk
Every AI application occasionally fails to meet user expectations. While individual failures are inevitable, understanding **which issues have the greatest business impact** is often difficult.
Most organizations track AI quality using metrics such as error rate or user satisfaction. While these metrics indicate that problems exist, they don't explain **what users are struggling with**, **which business processes are affected**, or **where the greatest risks to the business lie**.
Without this visibility, it's difficult to:
* Identify the most critical issues affecting users.
* Prioritize improvements based on business impact.
* Detect recurring problems before they become widespread.
* Understand which business processes generate the most user frustration.
* Measure whether AI quality is improving over time.
**Business Risks** closes this visibility gap by automatically identifying conversations that indicate business-critical issues and grouping them into meaningful risk categories. Instead of manually reviewing thousands of interactions, you gain a structured view of where your AI is creating friction and which problems require immediate attention.
# How Business Risks work
Nebuly analyzes every interaction to detect conversations that represent a potential business risk, such as failed tasks, operational issues, user frustration, or other high-impact situations.
Each interaction is classified into one or more **Business Risk** taxonomy classes, allowing Nebuly to aggregate similar issues and identify the problems affecting the largest number of users.
# The Business Risks report
The Business Risks report provides an overview of the issues users experience while interacting with your AI application.
It includes the following visualizations.
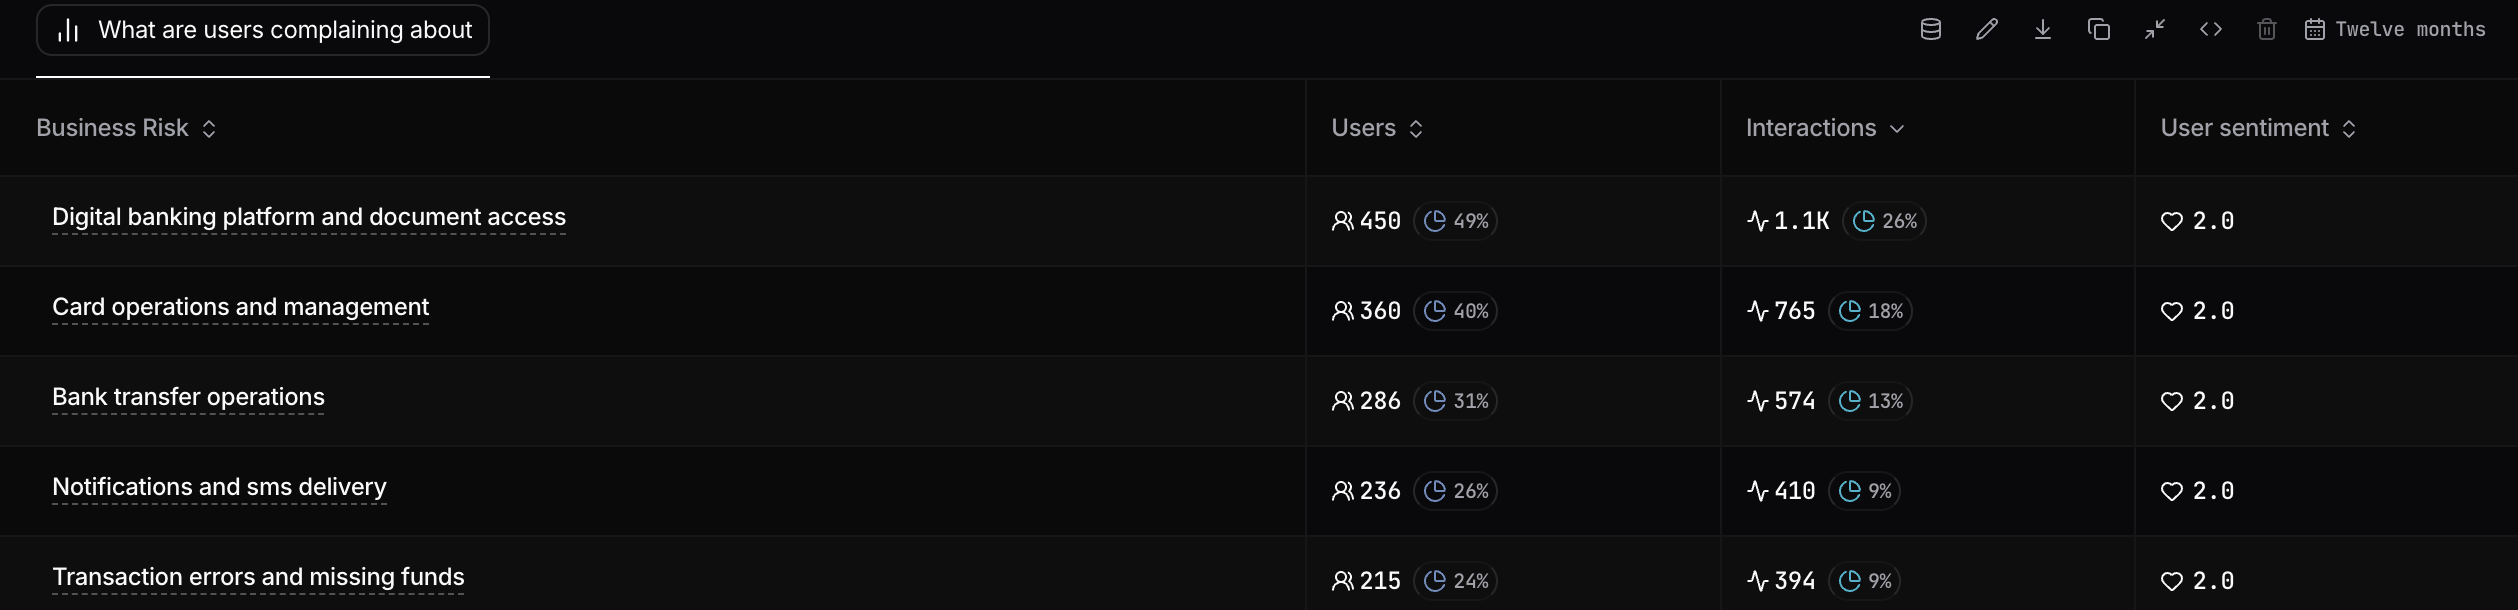
### What are users complaining about?
Ranks business risks by impact, helping you understand which problems affect the largest number of users. For each business risk, Nebuly reports:
* **Users** — Number of unique users affected.
* **Interactions** — Total interactions associated with that risk.
* **User sentiment** — Average sentiment of conversations related to the issue.
Use this table to prioritize the issues that have the greatest impact on your users. To investigate a specific risk further, open it in [**Explore mode**](/explore-chart-data), where you can inspect the underlying conversations, understand the root cause, and identify opportunities for improvement.
 ### Interactions with business risks
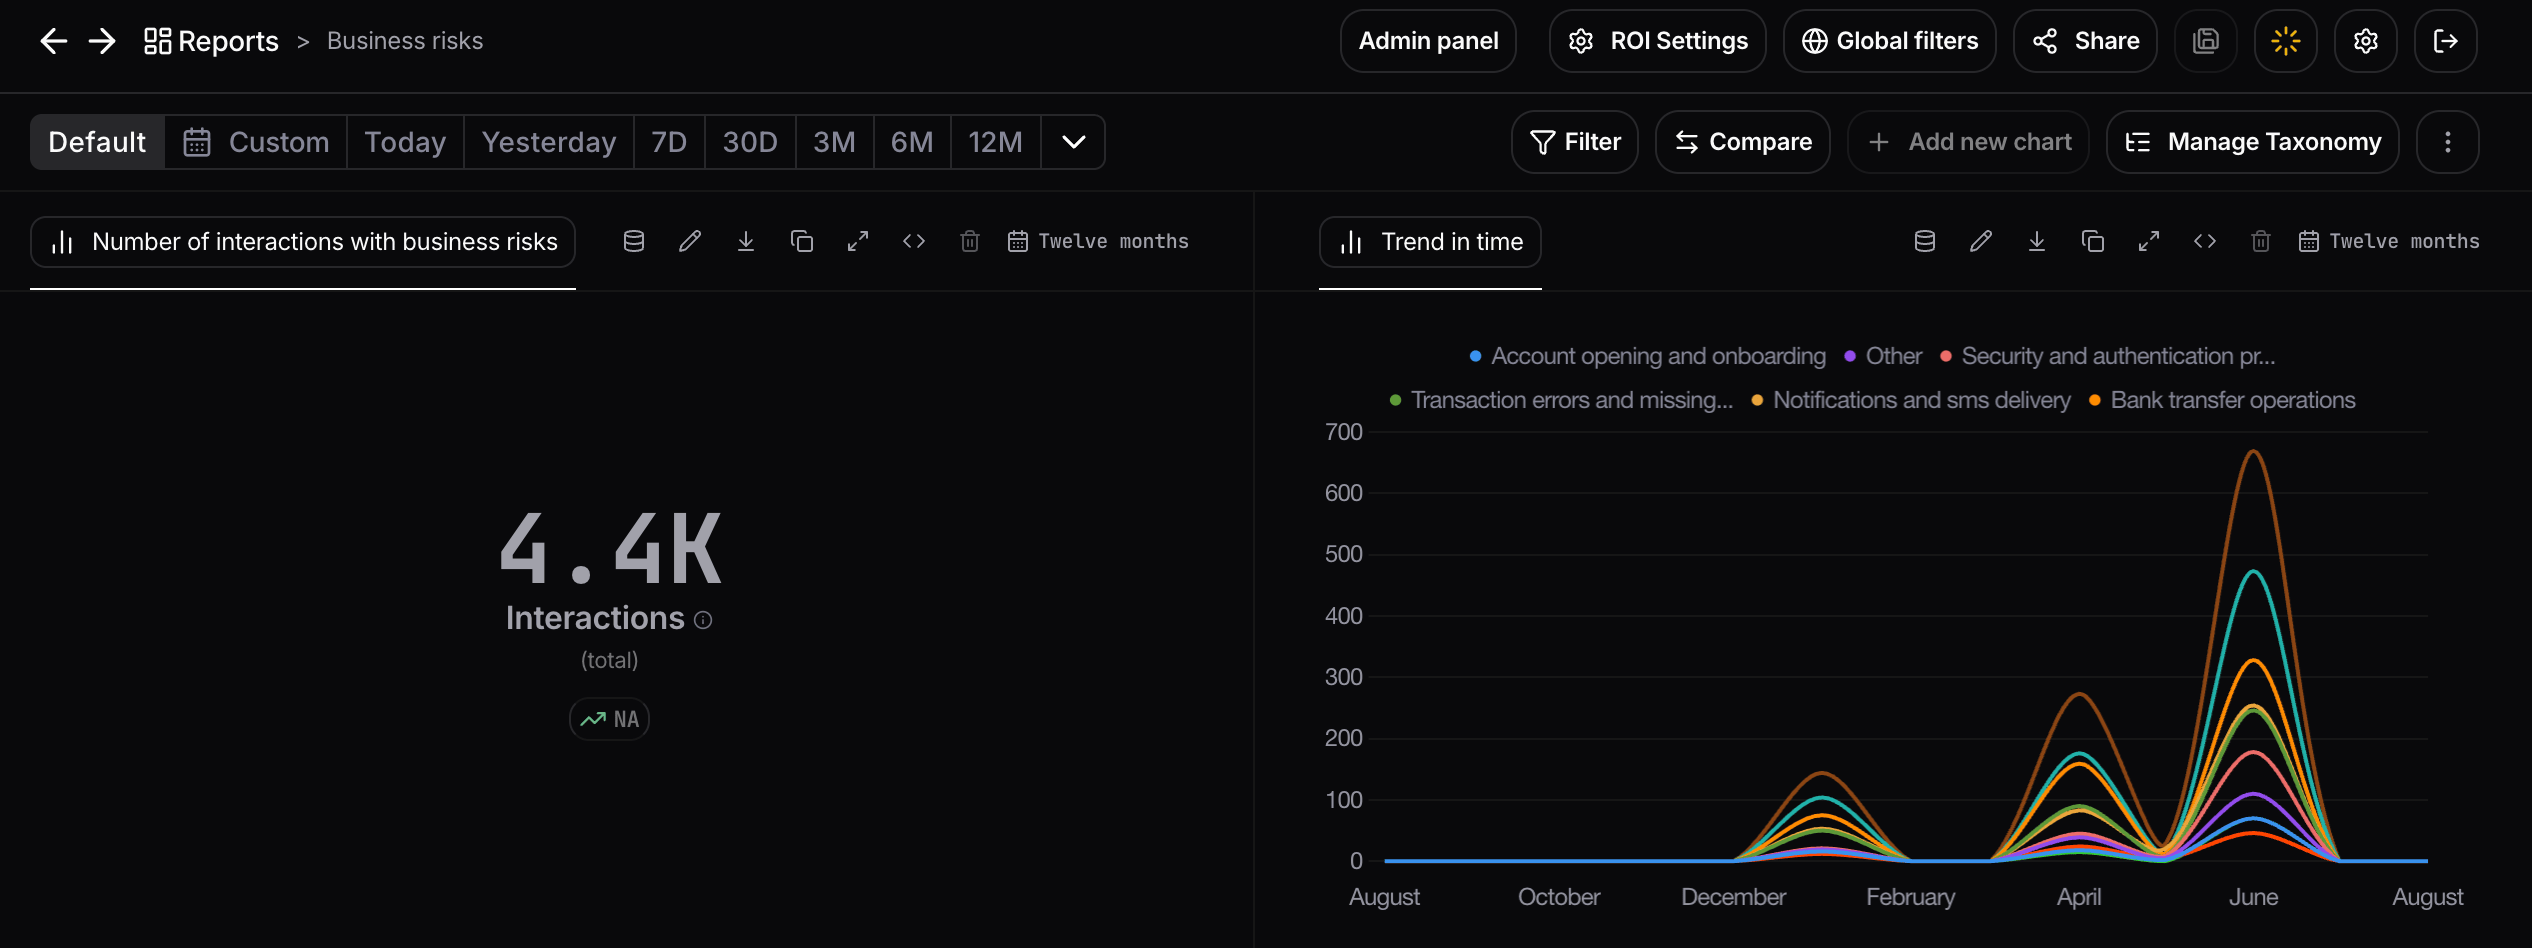
Shows the total number of interactions that were classified as containing a business risk during the selected period. Use this KPI to monitor the overall volume of business-critical issues and track whether AI quality is improving over time.
### Trend over time
Shows how each business risk category changes over time. Use this chart to identify emerging issues, monitor recurring problems, and measure the impact of product updates or AI improvements.
### Interactions with business risks
Shows the total number of interactions that were classified as containing a business risk during the selected period. Use this KPI to monitor the overall volume of business-critical issues and track whether AI quality is improving over time.
### Trend over time
Shows how each business risk category changes over time. Use this chart to identify emerging issues, monitor recurring problems, and measure the impact of product updates or AI improvements.
 # Building your own Business Risk reports
All Business Risk metrics and dimensions are available throughout Nebuly's reporting engine, allowing you to build custom reports tailored to your organization.
You can combine Business Risks with existing metrics, filters, and groupings to answer questions such as:
* Which business risks affect the largest number of users?
* Which AI agents generate the most business-critical issues?
* How have business risks changed over time?
* Which departments or user groups experience the most problems?
* Which topics are most frequently associated with business risks?
* Which business risks have the lowest user sentiment?
By combining Business Risks with the rest of your workspace data, you can identify high-impact issues, prioritize improvements, and continuously reduce the operational risks associated with your AI applications.
# Building your own Business Risk reports
All Business Risk metrics and dimensions are available throughout Nebuly's reporting engine, allowing you to build custom reports tailored to your organization.
You can combine Business Risks with existing metrics, filters, and groupings to answer questions such as:
* Which business risks affect the largest number of users?
* Which AI agents generate the most business-critical issues?
* How have business risks changed over time?
* Which departments or user groups experience the most problems?
* Which topics are most frequently associated with business risks?
* Which business risks have the lowest user sentiment?
By combining Business Risks with the rest of your workspace data, you can identify high-impact issues, prioritize improvements, and continuously reduce the operational risks associated with your AI applications.