> ## Documentation Index
> Fetch the complete documentation index at: https://docs.nebuly.com/llms.txt
> Use this file to discover all available pages before exploring further.
# Topics
Every AI application receives thousands of conversations, but knowing **what users are actually asking** is often surprisingly difficult.
Most organizations measure AI usage through conversations, active users, or requests processed. While these metrics show adoption, they don't explain **why users are interacting with the AI**, **which business tasks they need help with**, or **where the greatest demand exists**.
Without this visibility, it's difficult to:
* Understand the most common user needs.
* Identify the business processes your AI supports most.
* Detect emerging trends and changing customer behavior.
* Prioritize improvements based on real user demand.
* Measure adoption across different use cases.
**Topics** closes this visibility gap by automatically categorizing every conversation into meaningful business topics and user actions. Instead of manually reviewing thousands of interactions, you get a structured view of your AI usage, helping you understand:
* **Customer interactions** – Discover what users are asking your AI, which business topics generate the most demand, and how customer needs evolve over time.
* **Employee experience** – Understand how employees use AI in their daily work, which tasks they rely on most, and identify opportunities to improve productivity, satisfaction, and AI adoption.
# How Topics works
Nebuly analyzes every interactions and classifies it using the **Topics** **taxonomy**. Read [here](/guides/setup/taxonomy) to learn more about taxonomies.
Every interaction is automatically assigned to the most relevant Topic and sub-topic, allowing Nebuly to aggregate conversations into meaningful business insights instead of treating them as isolated messages.
# The Topics report
The Topics report provides a complete overview of what users discuss with your AI application and how those requests are distributed across your taxonomy.
It includes the following visualizations.
### Topics of discussion
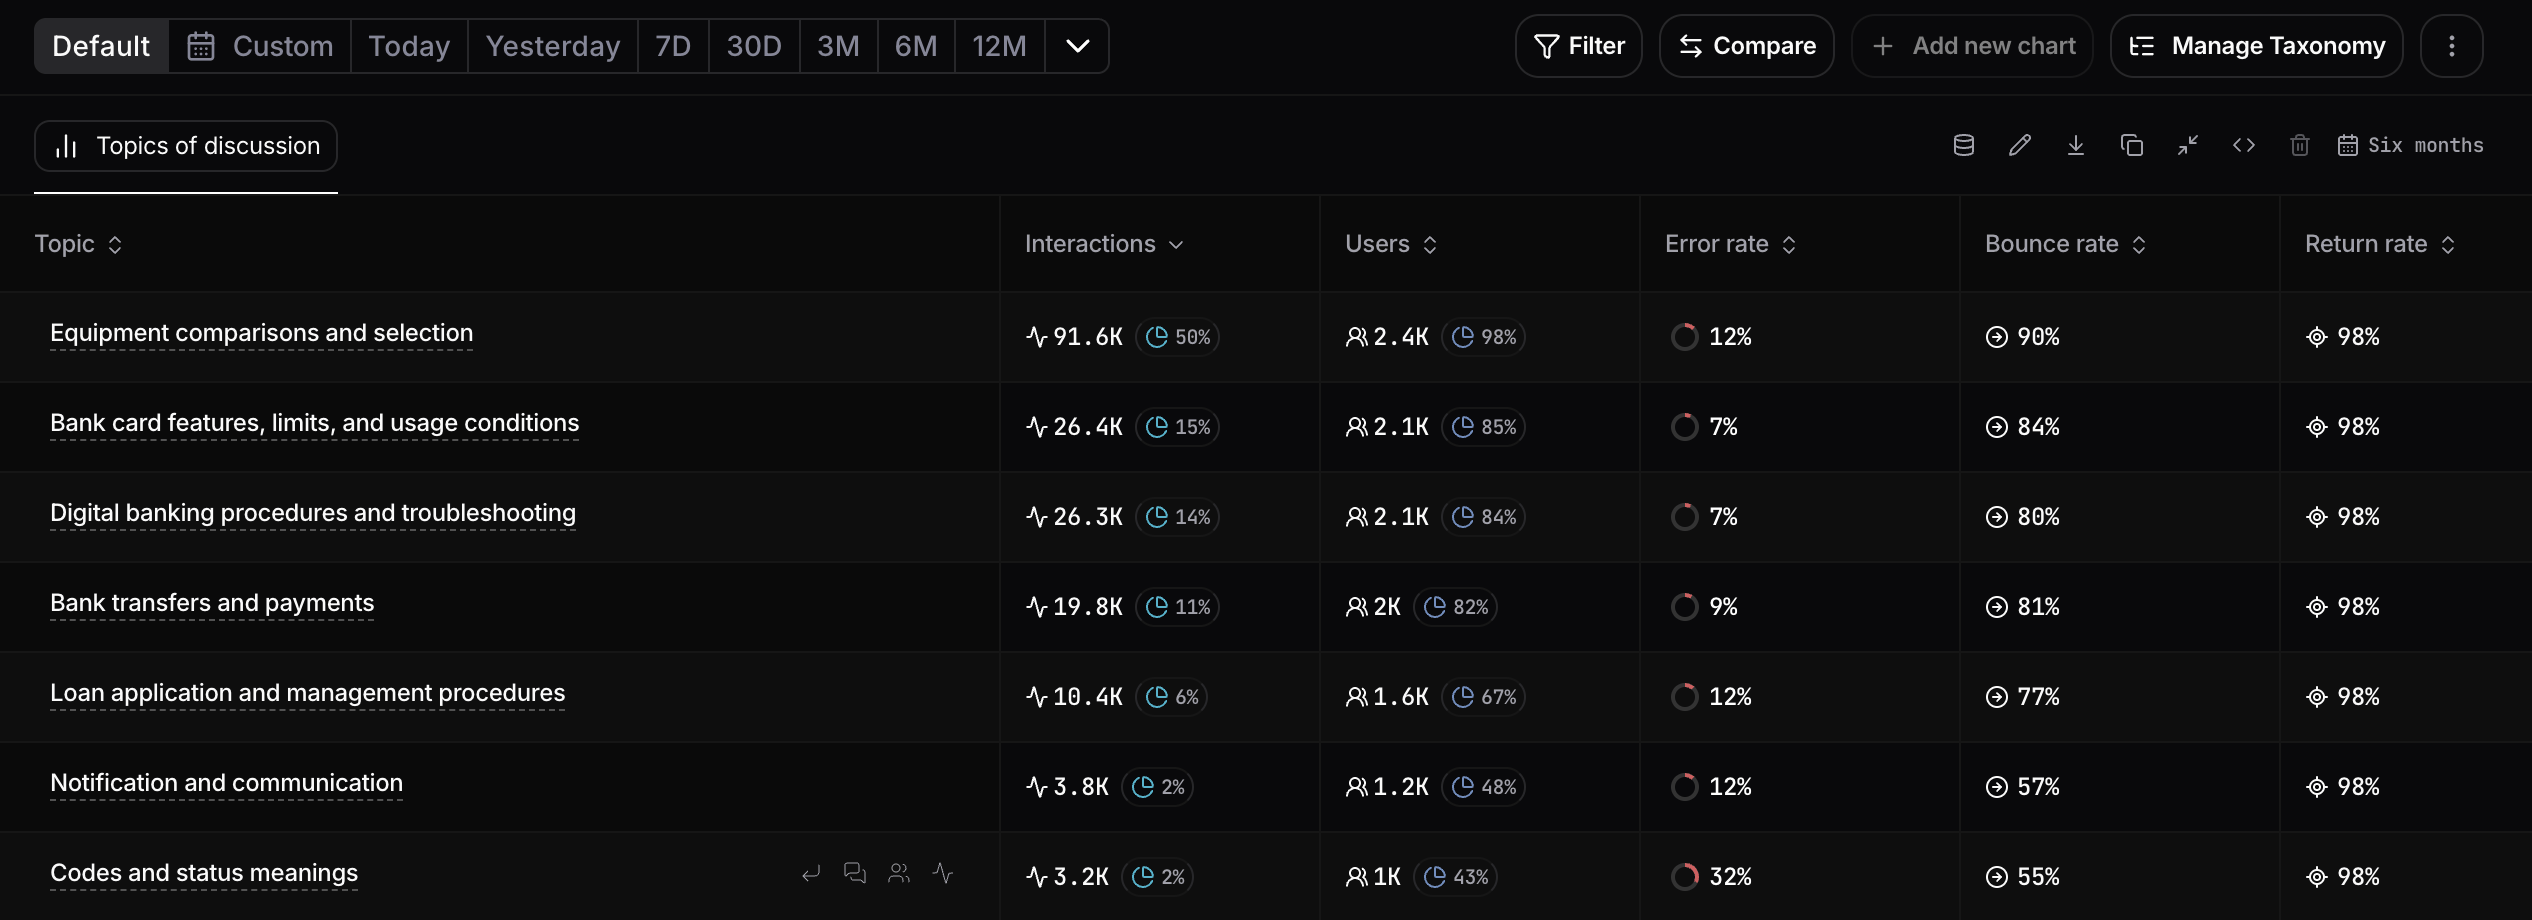
Shows every Topic in your taxonomy ranked by usage.
For each topic, Nebuly reports:
* **Interactions** — Total interactions classified under the topic.
* **Users** — Number of unique users discussing that topic.
* **Error rate** — Percentage of interactions that resulted in an AI failure.
* **Bounce rate** — Percentage of users who left after interacting with that topic.
* **Return rate** — Percentage of users who returned after interacting with that topic.
Use this table to identify your most popular business domains and compare their performance across key metrics such as interactions, users, error rate, bounce rate, and return rate. To investigate a topic further, open it in **Explore mode**, where you can drill down into its underlying sub-topics, inspect the conversations behind the data, and better understand what users are trying to accomplish. Read more about Nebuly's Explore mode [here](/explore-chart-data).
 ### Topics of discussion over time
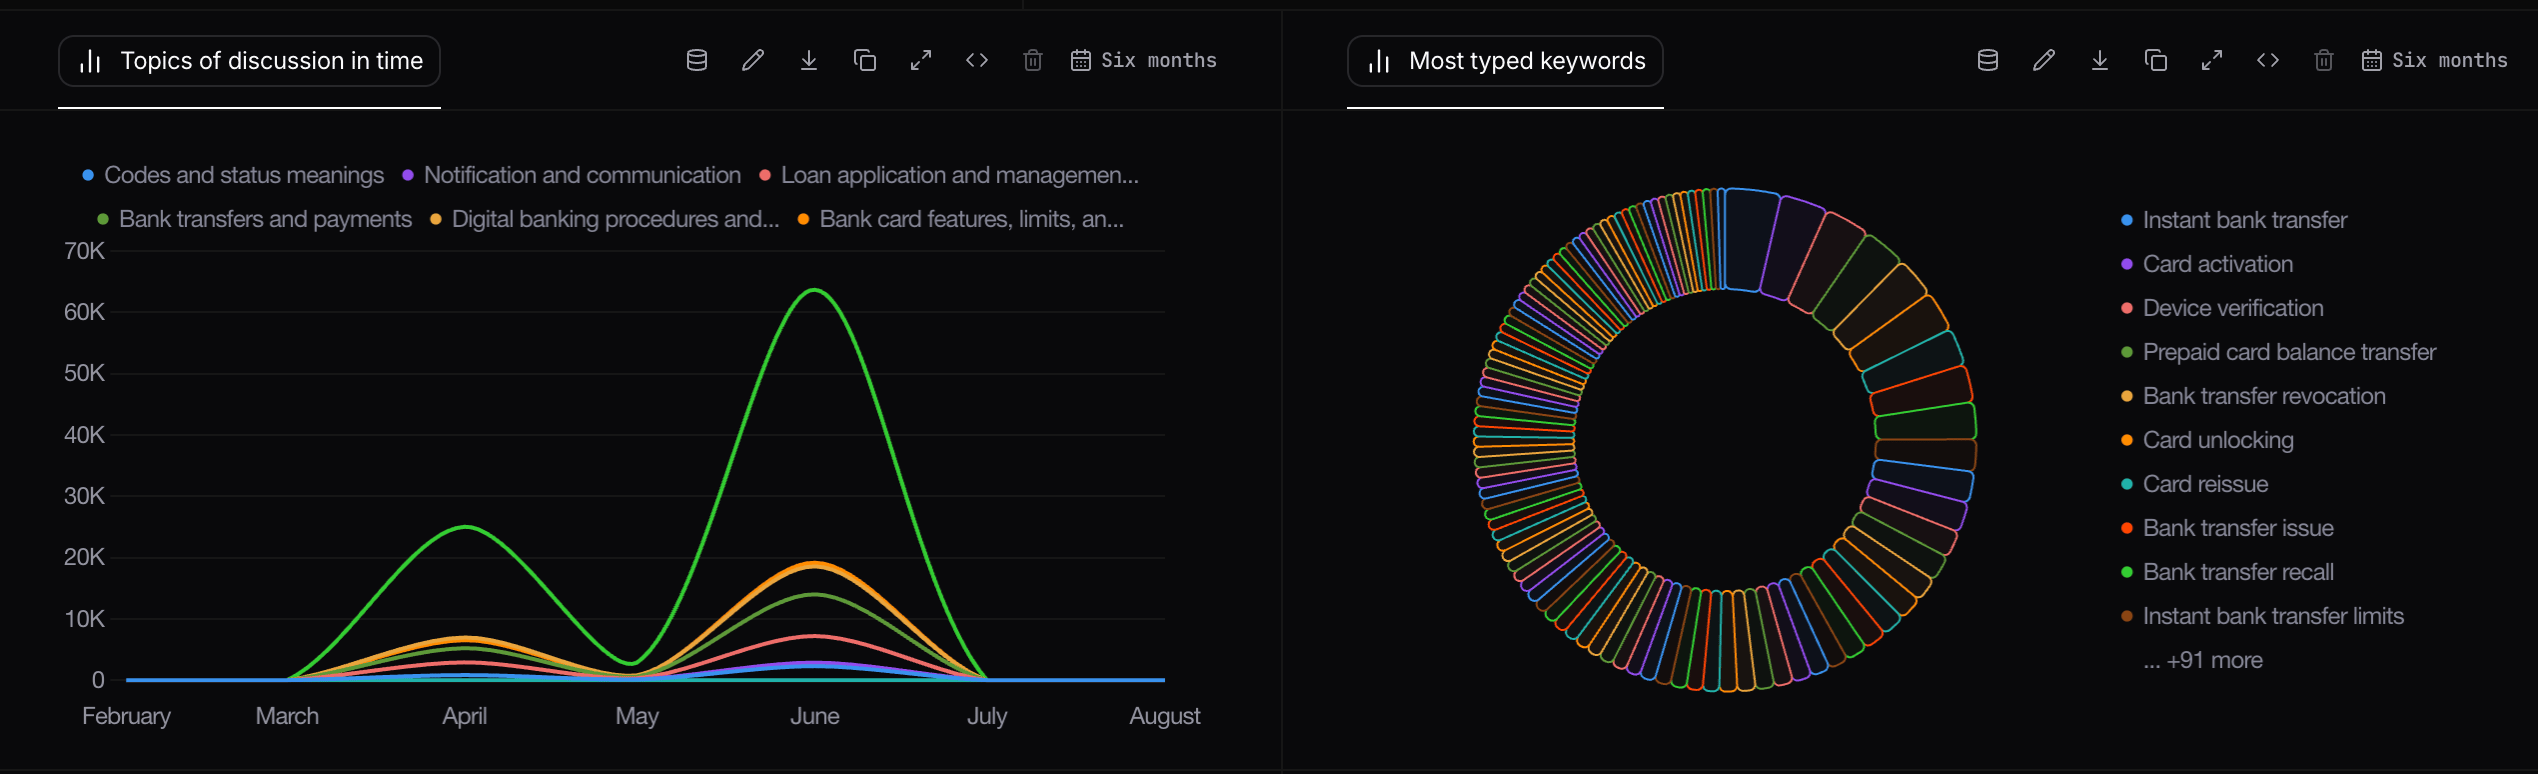
Tracks how conversation volume changes for each Topic throughout the selected time period. Use it to monitor trends, detect spikes in demand, or evaluate the impact of product launches, marketing campaigns, or operational events.
### Most typed keywords
Shows the most frequently occurring keywords across user conversations. This visualization helps identify recurring terminology, emerging issues, popular products, and common customer language that may not yet be reflected in your taxonomy.
### Topics of discussion over time
Tracks how conversation volume changes for each Topic throughout the selected time period. Use it to monitor trends, detect spikes in demand, or evaluate the impact of product launches, marketing campaigns, or operational events.
### Most typed keywords
Shows the most frequently occurring keywords across user conversations. This visualization helps identify recurring terminology, emerging issues, popular products, and common customer language that may not yet be reflected in your taxonomy.
 ### User intent over time
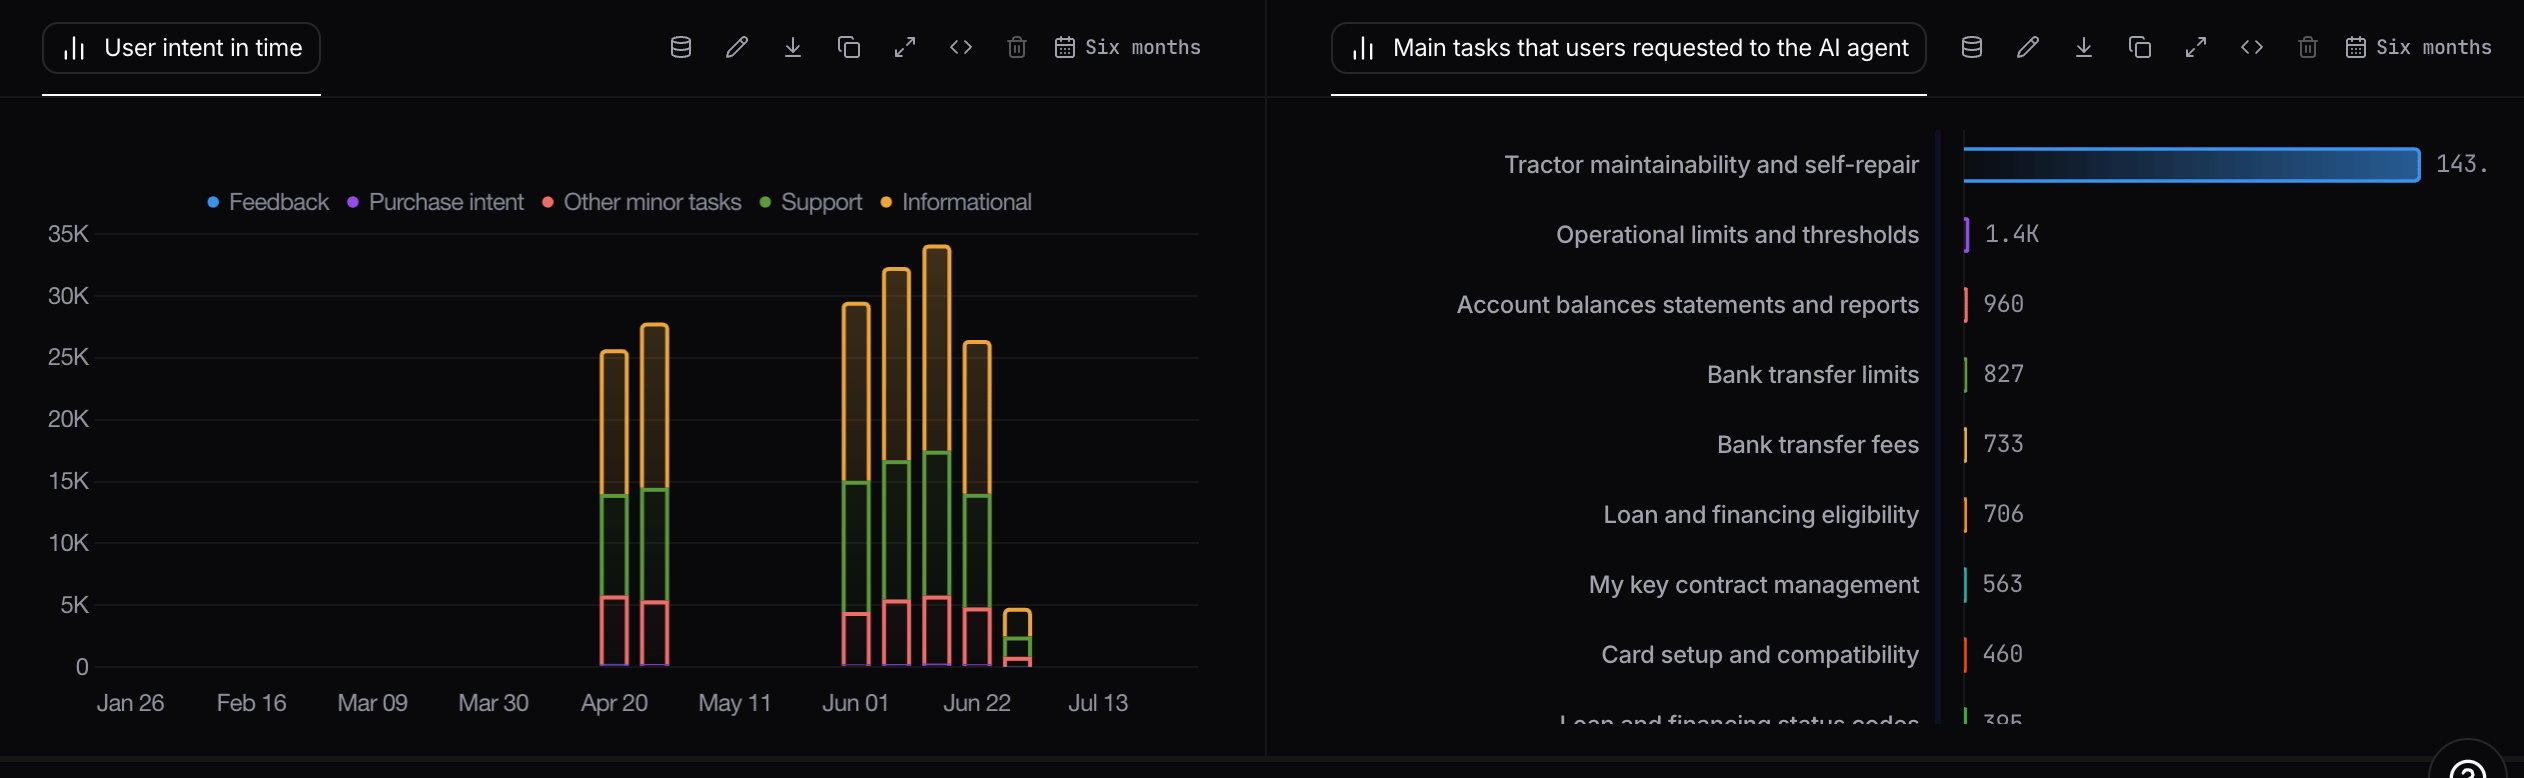
Shows how different categories of user intent evolve over time. Use it to identify seasonal trends, changes in customer behavior, and shifts in how users interact with your AI.
### Main tasks requested
Displays the most common **User Actions** performed by your AI. This chart highlights the individual tasks users request most frequently, helping you understand where AI delivers the most value and which workflows deserve further optimization.
### User intent over time
Shows how different categories of user intent evolve over time. Use it to identify seasonal trends, changes in customer behavior, and shifts in how users interact with your AI.
### Main tasks requested
Displays the most common **User Actions** performed by your AI. This chart highlights the individual tasks users request most frequently, helping you understand where AI delivers the most value and which workflows deserve further optimization.
 # Building your own Topics reports
All Topic taxonomies dimensions are available throughout Nebuly's reporting engine, allowing you to build custom reports tailored to your organization.
You can combine Topics with existing metrics, filters, and groupings to answer questions such as:
* Which business topics generate the highest conversation volume?
* Which topics are growing the fastest?
* Which topics have the highest error rate?
* Which AI agents receive the most requests for a specific topic?
* How do topics differ across departments, regions, or user groups?
* Which business processes are most frequently automated by AI?
By combining Topics with the rest of your workspace data, you can understand user demand, identify optimization opportunities, and continuously improve your AI experience.
# Building your own Topics reports
All Topic taxonomies dimensions are available throughout Nebuly's reporting engine, allowing you to build custom reports tailored to your organization.
You can combine Topics with existing metrics, filters, and groupings to answer questions such as:
* Which business topics generate the highest conversation volume?
* Which topics are growing the fastest?
* Which topics have the highest error rate?
* Which AI agents receive the most requests for a specific topic?
* How do topics differ across departments, regions, or user groups?
* Which business processes are most frequently automated by AI?
By combining Topics with the rest of your workspace data, you can understand user demand, identify optimization opportunities, and continuously improve your AI experience.