> ## Documentation Index
> Fetch the complete documentation index at: https://docs.nebuly.com/llms.txt
> Use this file to discover all available pages before exploring further.
# Events
> Timeline annotations you create to mark moments in time on charts and correlate metric movements with product or business changes.
**Events** in Nebuly are timeline annotations you create to mark moments in time on charts. They appear as vertical lines on time-series visualizations and let you correlate metric movements with product, marketing, or business changes: a model rollout, a prompt update, a marketing push, an incident, a release.
Events are not user data and are not ingested through the [Interaction API](https://docs.nebuly.com/tracking/api-reference/events/post-events-interaction-with-trace-v2). They are configuration objects, scoped **per project**, that you create and manage directly in the platform.
## When to use events
* **Mark releases.** Tag the day you shipped a new model version, prompt, or RAG pipeline so you can see whether sentiment, error rate, or task completion changed afterwards.
* **Mark marketing or onboarding pushes.** When you run a campaign that drives new users to the AI product, an event helps explain spikes in conversation volume.
* **Mark incidents.** A model provider outage or a backend bug becomes much easier to investigate when it is annotated on the chart.
* **Mark business milestones.** Quarter ends, fiscal-year boundaries, or compliance deadlines.
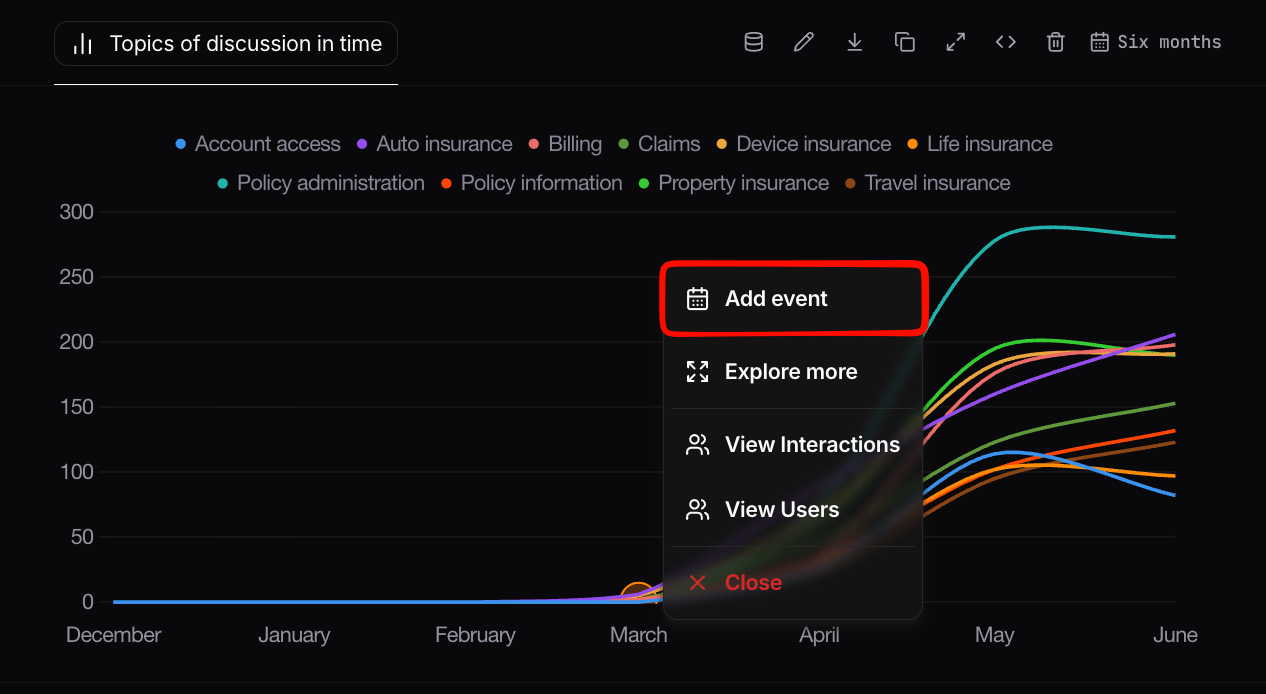
## Create an event
**From a chart**: click on the chart's time axis at the moment you want to annotate. This is the fastest way to capture an event in the flow of analysis.
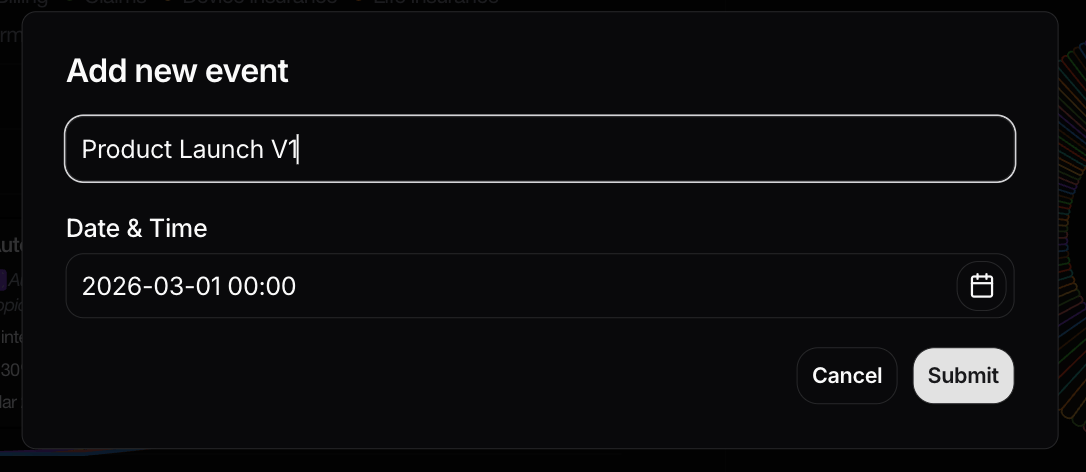 When creating an event you can specify:
* A **title** (e.g. `Model upgraded to GPT-4o`).
* A **timestamp**.
## Visualize events
Once created, events show up as vertical reference lines on every time-series chart in the project. You can hover an event to see its title and description.
In most chart configurations there is a toggle to **show or hide events** on a per-chart basis, which is useful when you want a clean export or are presenting a single metric without the visual noise of multiple annotations.
When creating an event you can specify:
* A **title** (e.g. `Model upgraded to GPT-4o`).
* A **timestamp**.
## Visualize events
Once created, events show up as vertical reference lines on every time-series chart in the project. You can hover an event to see its title and description.
In most chart configurations there is a toggle to **show or hide events** on a per-chart basis, which is useful when you want a clean export or are presenting a single metric without the visual noise of multiple annotations.