> ## Documentation Index
> Fetch the complete documentation index at: https://docs.nebuly.com/llms.txt
> Use this file to discover all available pages before exploring further.
# Navigating Nebuly
> A quick tour of the Nebuly interface: the top bar, the sidebar, Reports, and Live Data.
This page gives you a quick tour of the Nebuly interface so you know where to find everything.
The screen is made up of three areas: the **top bar**, the **sidebar**, and the **main view**.
## Top bar
 The top bar stays visible wherever you are in the platform. It includes:
* **Global filters** that apply across the whole platform. They stay active as you move between pages, so the data you see everywhere reflects the same selection until you change it. For the fields you can filter by and how to save filter sets, see [Filtering](/guides/filtering).
* **Share** button, which generates anonymous sharing links. For details, see [Sharing pages in Nebuly](/guides/sharing-pages).
* Access to the **Settings**.
## Sidebar
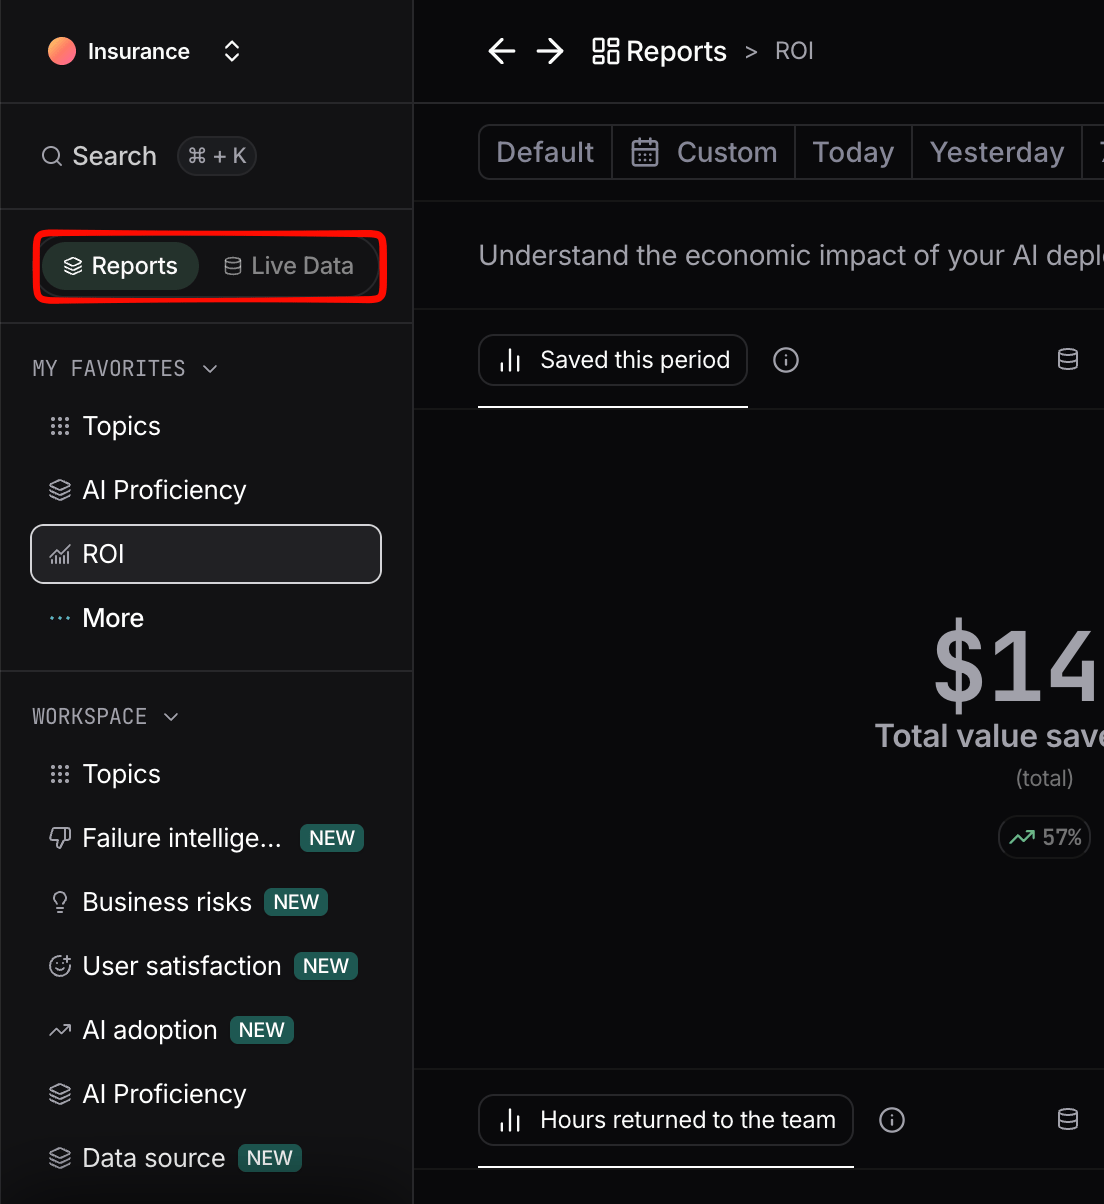
The sidebar controls what you see in the main view. It is split into two tabs: **Reports** and **Live Data**.
**Reports** focus on aggregated data, giving you a snapshot of your key metrics through charts.
**Live Data** focuses on analyzing raw activity, such as individual interactions and conversations.
## Reports
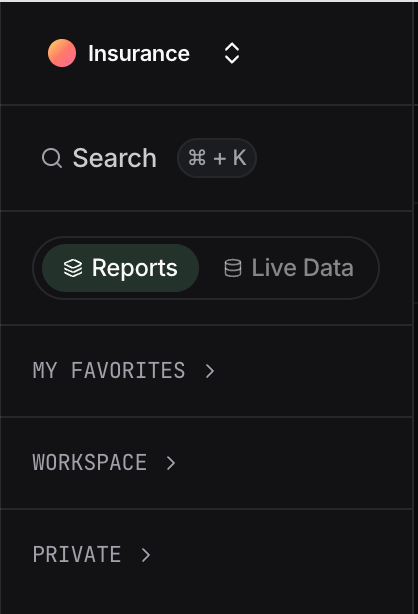
Under the **Reports** tab, reports are organized into three sections:
* **Favorites**: reports you have starred for quick access.
* **Workspace**: reports shared across the platform with all users.
* **Private**: reports you own, only visible to you.
In Nebuly, **reports are the entry point into deeper analytics**, not just static dashboards. A report's charts are interactive: starting from a high-level view such as the default **Topics report**, you can drill down from a topic into the conversations behind it, all the way to a single interaction, without ever leaving the report.
Details are also covered in the Reports guide: see [Drill into a data point](/guides/reports-guide#drill-into-a-data-point) and [Explore Mode](/guides/reports-guide#explore-mode).
## Live Data
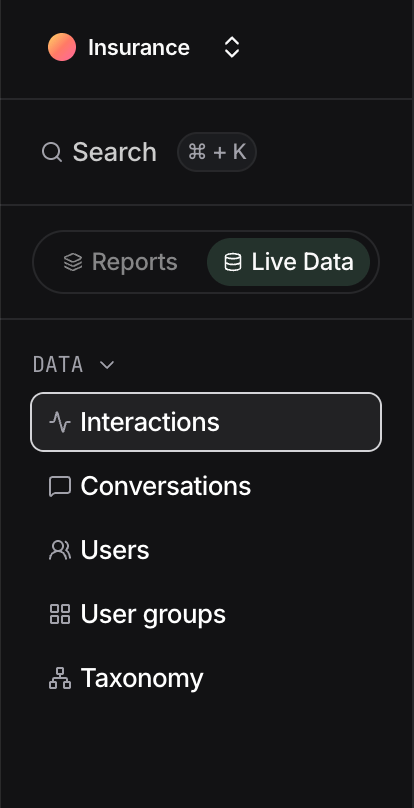
The **Live Data** tab brings interactions, conversations, users, and user groups together in one place, so you can move between aggregated insights and the underlying activity without switching pages. For definitions of each data type, see [Nebuly Data Types](/guides/data-types).
Admins also see **[Taxonomy](/guides/taxonomy)**, used to govern the clusters that power reports (Topics, Intents, Business risks, Problem types) and the tags that add business context to interactions, where they can be edited, merged, renamed, and deleted. For details, see [Taxonomy](/guides/taxonomy) and [Enrichment and the importance of tagging](/guides/enrichment-and-tagging). {/* Claude (per your TBD): linked "Taxonomy" to the taxonomy page */}
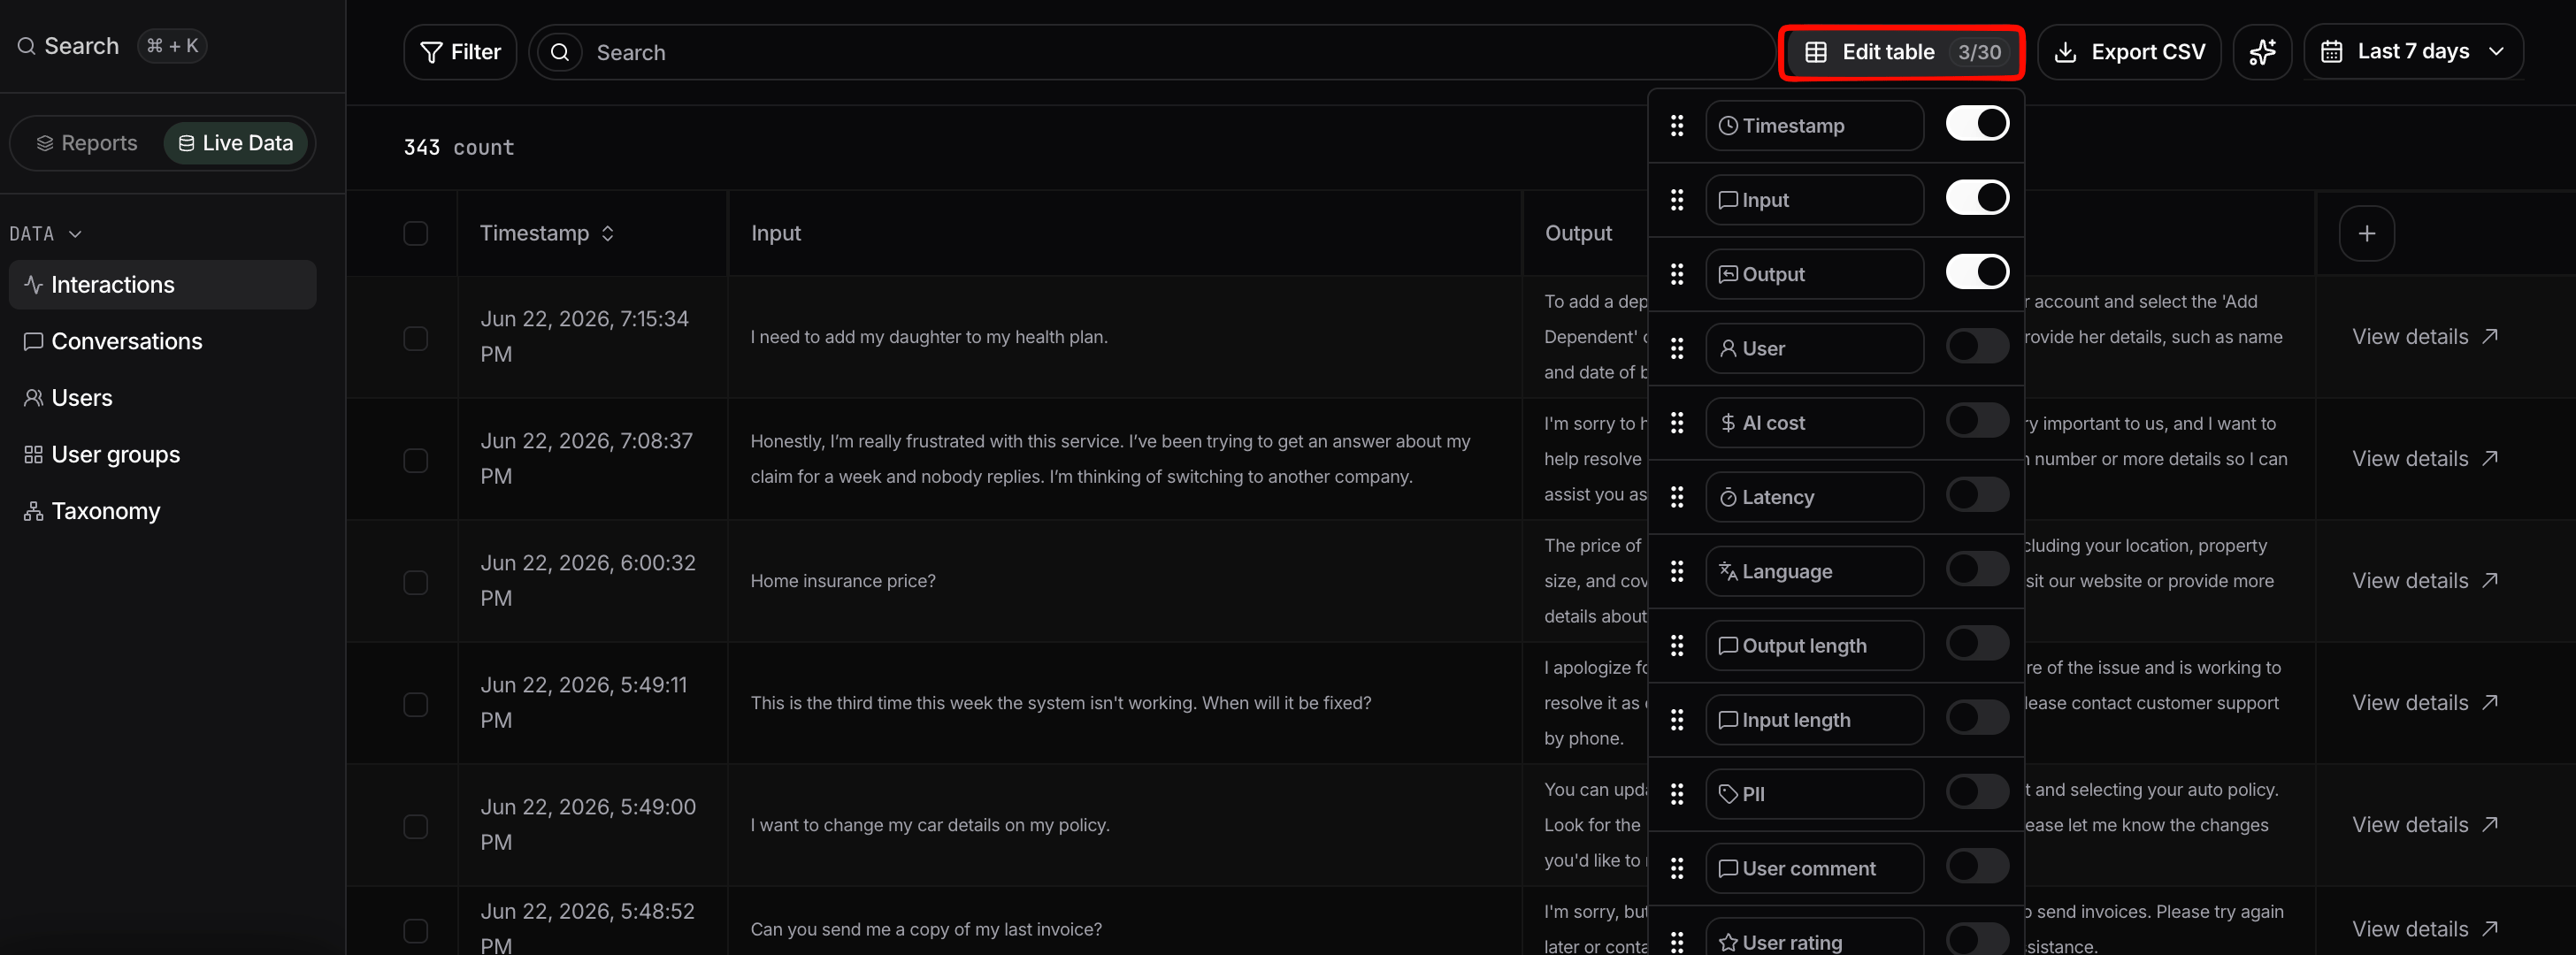
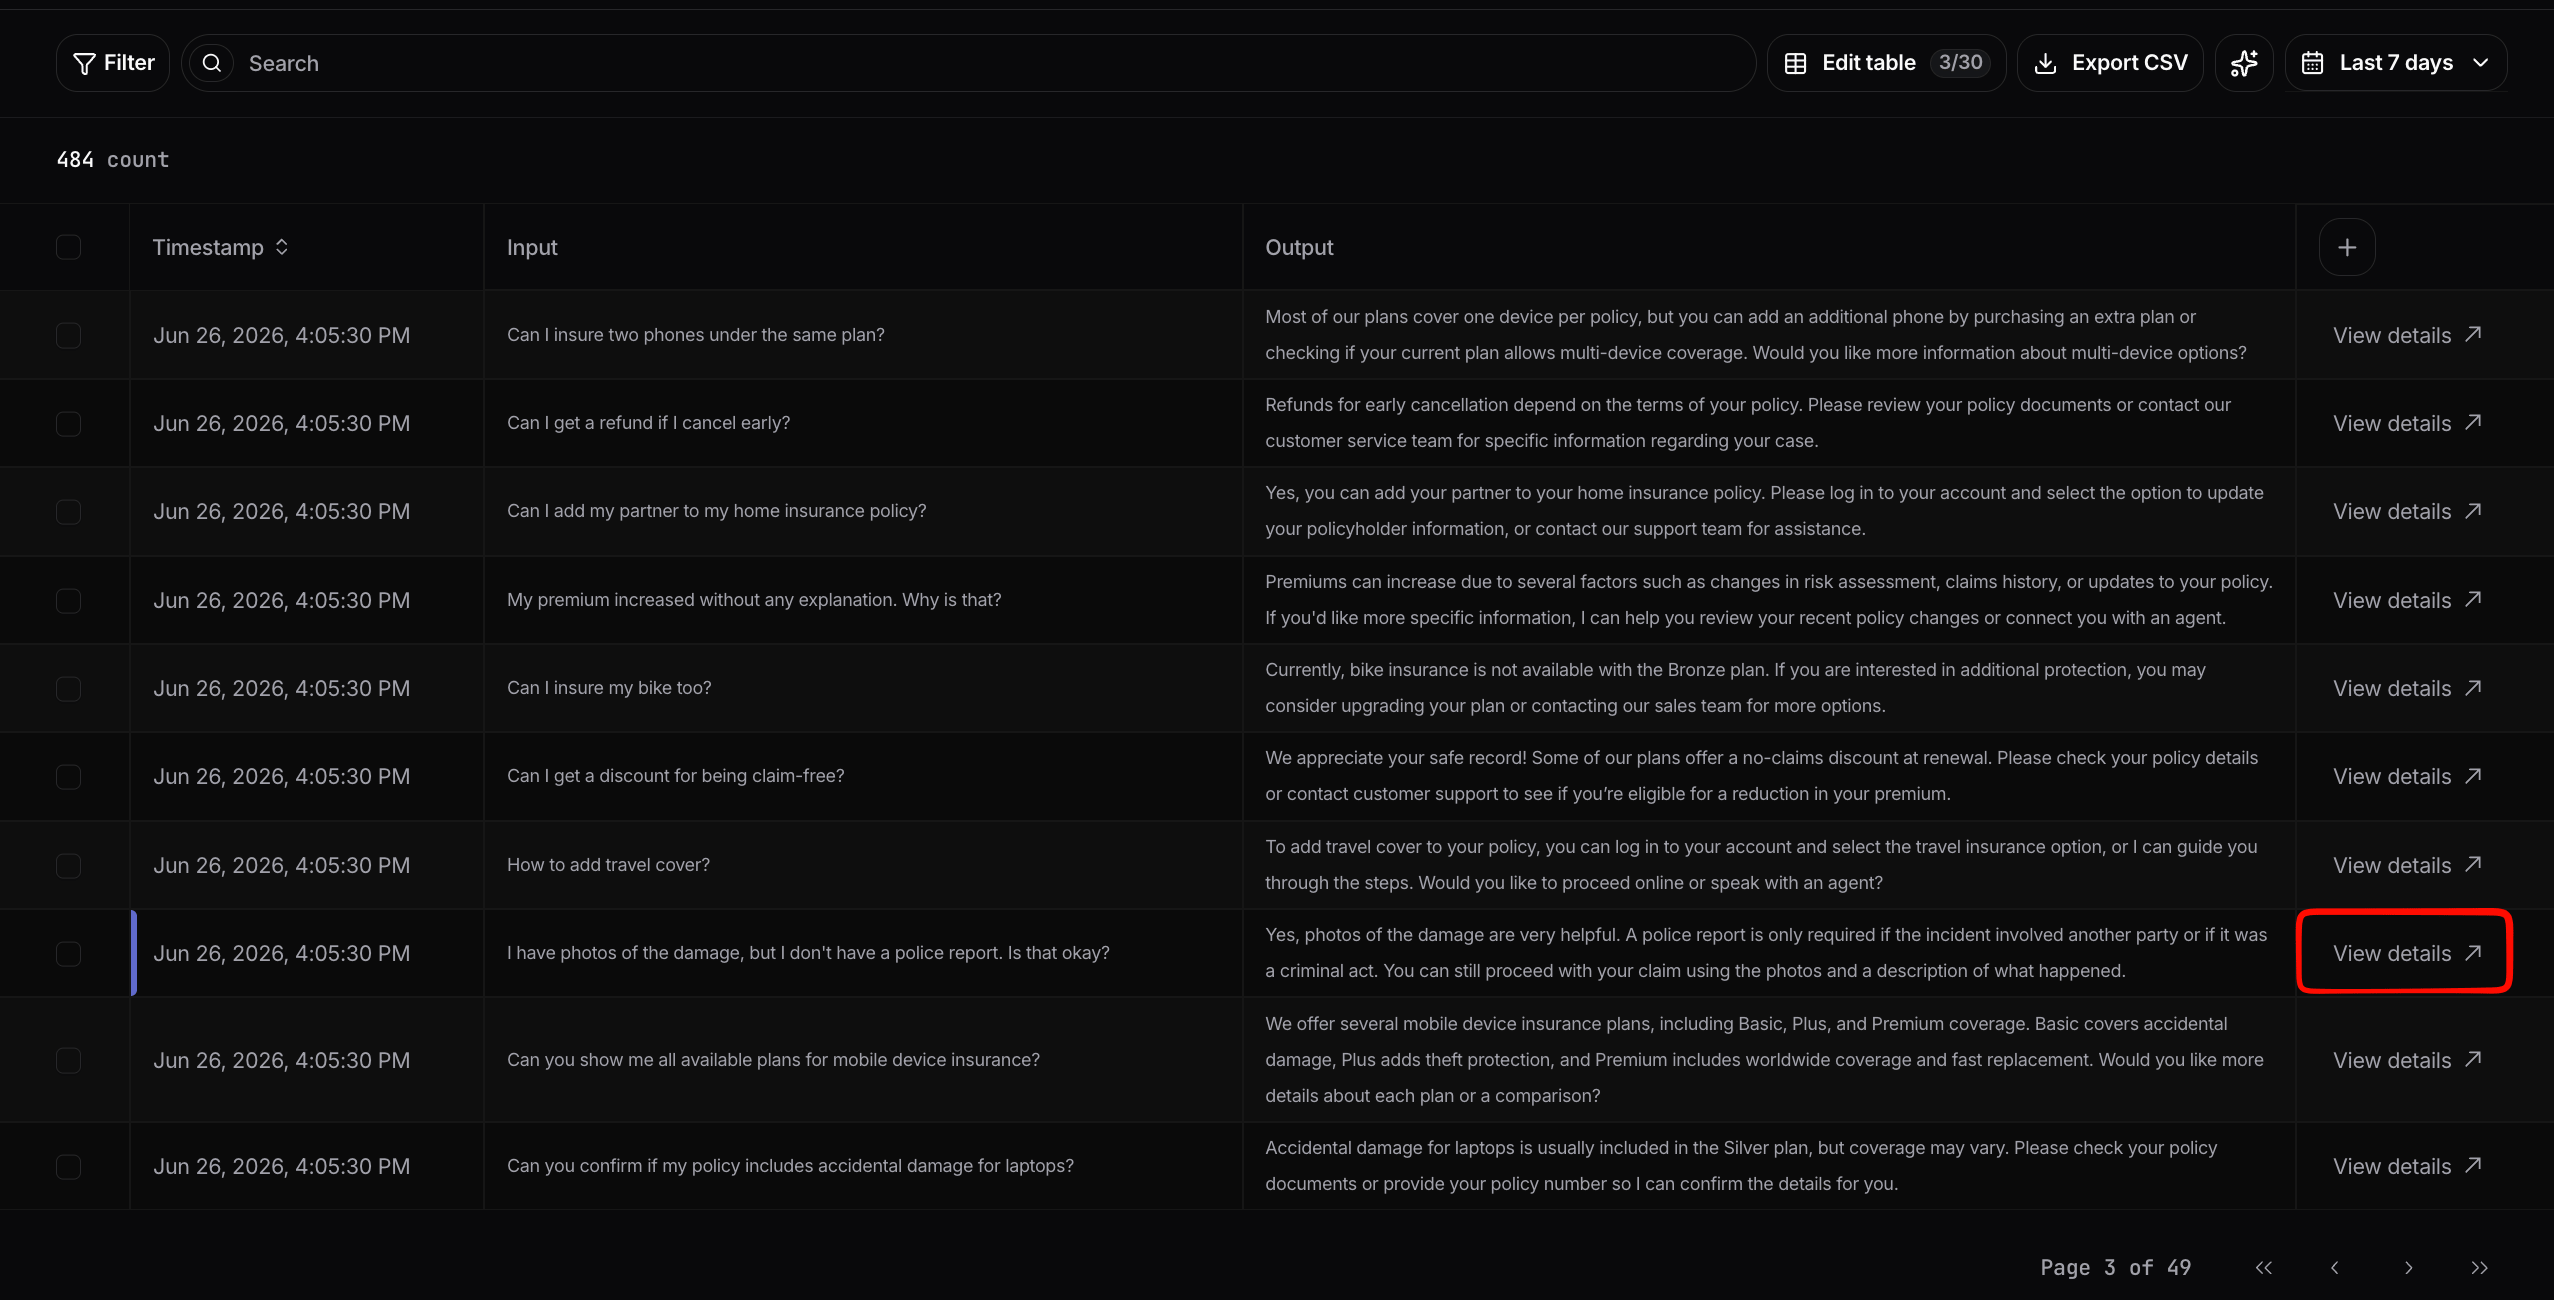
### Table views
Live Data is shown as tables. You can add or remove columns depending on the data type you are viewing.
Exporting is supported in **CSV** format. Row shortcuts let you jump straight from a row to the related users, interactions, or conversations, so you can drill from a summary into the detail behind it.
To inspect a single interaction, click **View details** in the last column of a row. Once the details panel is open, click any other message in the same conversation and its details load in place, so you can move through a conversation without leaving the panel.
The top bar stays visible wherever you are in the platform. It includes:
* **Global filters** that apply across the whole platform. They stay active as you move between pages, so the data you see everywhere reflects the same selection until you change it. For the fields you can filter by and how to save filter sets, see [Filtering](/guides/filtering).
* **Share** button, which generates anonymous sharing links. For details, see [Sharing pages in Nebuly](/guides/sharing-pages).
* Access to the **Settings**.
## Sidebar
The sidebar controls what you see in the main view. It is split into two tabs: **Reports** and **Live Data**.
**Reports** focus on aggregated data, giving you a snapshot of your key metrics through charts.
**Live Data** focuses on analyzing raw activity, such as individual interactions and conversations.
## Reports
Under the **Reports** tab, reports are organized into three sections:
* **Favorites**: reports you have starred for quick access.
* **Workspace**: reports shared across the platform with all users.
* **Private**: reports you own, only visible to you.
In Nebuly, **reports are the entry point into deeper analytics**, not just static dashboards. A report's charts are interactive: starting from a high-level view such as the default **Topics report**, you can drill down from a topic into the conversations behind it, all the way to a single interaction, without ever leaving the report.
Details are also covered in the Reports guide: see [Drill into a data point](/guides/reports-guide#drill-into-a-data-point) and [Explore Mode](/guides/reports-guide#explore-mode).
## Live Data
The **Live Data** tab brings interactions, conversations, users, and user groups together in one place, so you can move between aggregated insights and the underlying activity without switching pages. For definitions of each data type, see [Nebuly Data Types](/guides/data-types).
Admins also see **[Taxonomy](/guides/taxonomy)**, used to govern the clusters that power reports (Topics, Intents, Business risks, Problem types) and the tags that add business context to interactions, where they can be edited, merged, renamed, and deleted. For details, see [Taxonomy](/guides/taxonomy) and [Enrichment and the importance of tagging](/guides/enrichment-and-tagging). {/* Claude (per your TBD): linked "Taxonomy" to the taxonomy page */}
### Table views
Live Data is shown as tables. You can add or remove columns depending on the data type you are viewing.
Exporting is supported in **CSV** format. Row shortcuts let you jump straight from a row to the related users, interactions, or conversations, so you can drill from a summary into the detail behind it.
To inspect a single interaction, click **View details** in the last column of a row. Once the details panel is open, click any other message in the same conversation and its details load in place, so you can move through a conversation without leaving the panel.
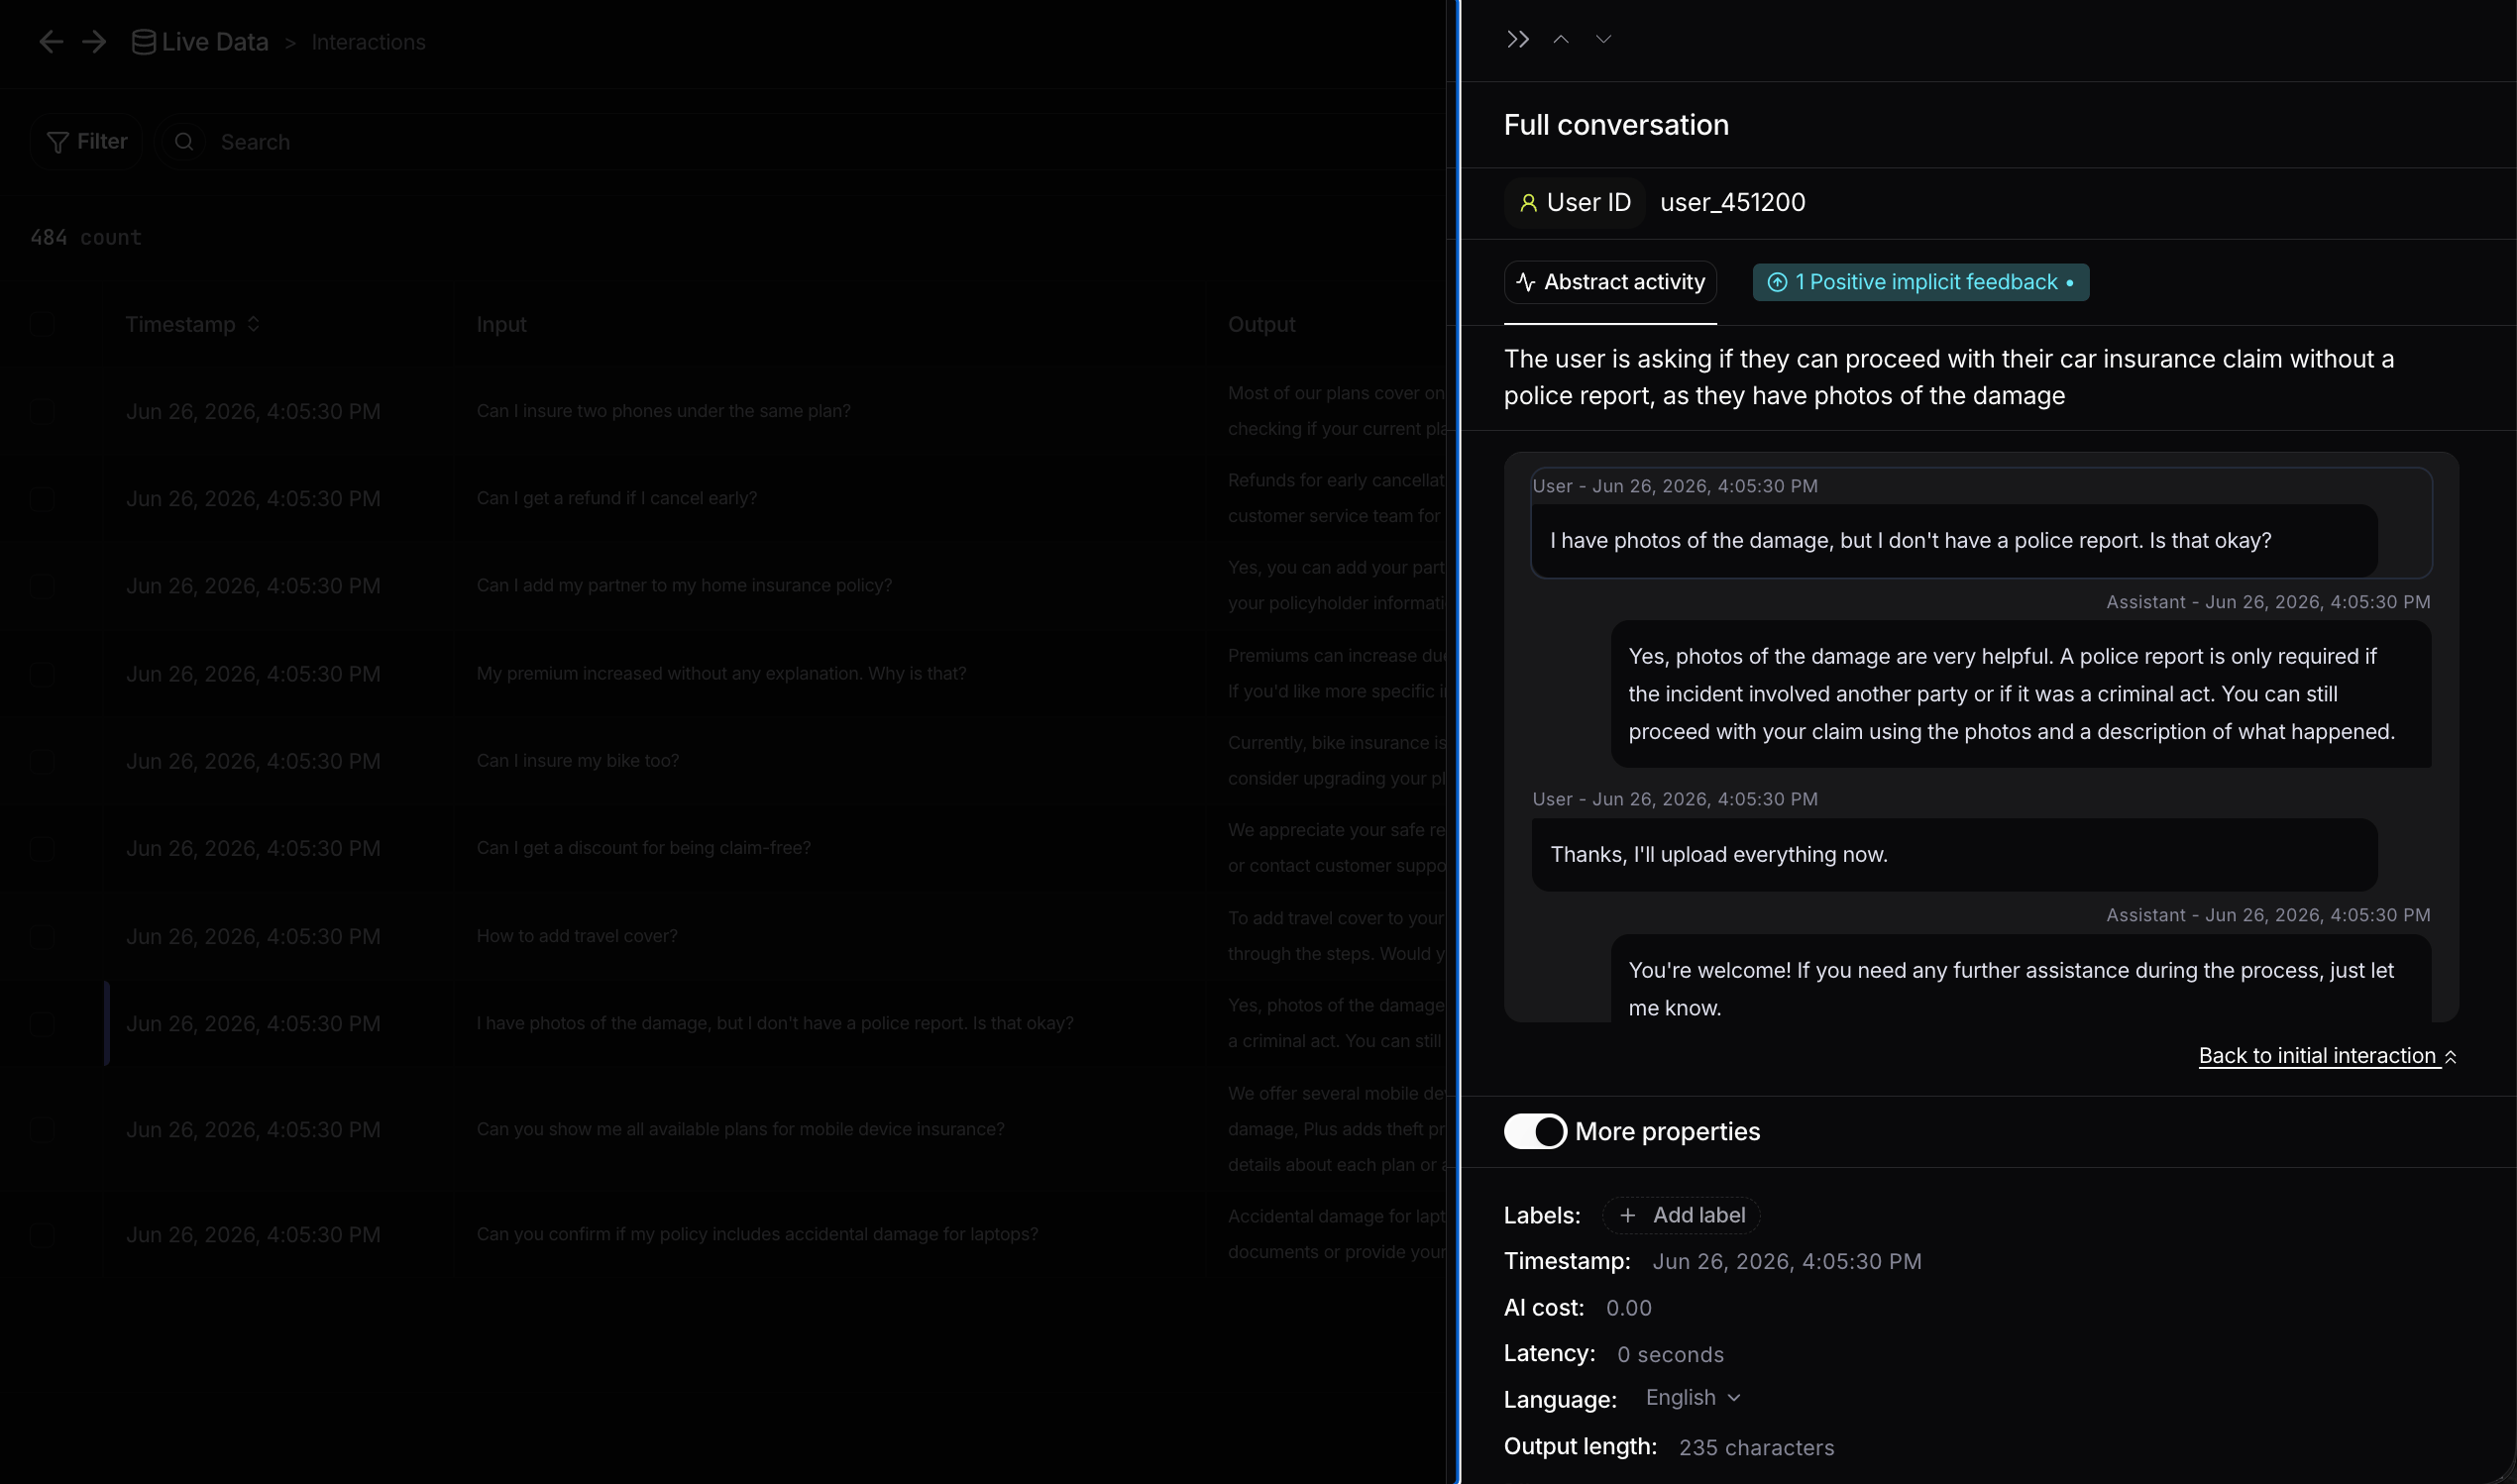
 ### Interaction view
Every interaction in a Live Data table can be opened on its own to investigate it in full. Click **View details** in the last column of a row to open the interaction view.
### Interaction view
Every interaction in a Live Data table can be opened on its own to investigate it in full. Click **View details** in the last column of a row to open the interaction view.
 The interaction view opens as a panel showing the **full conversation**: the user ID, any feedback or activity tags, an AI-generated summary of what the user is trying to do, and the complete message thread between the user and the assistant with timestamps. You can scroll through every turn and use **Back to initial interaction** to return to the message you started from.
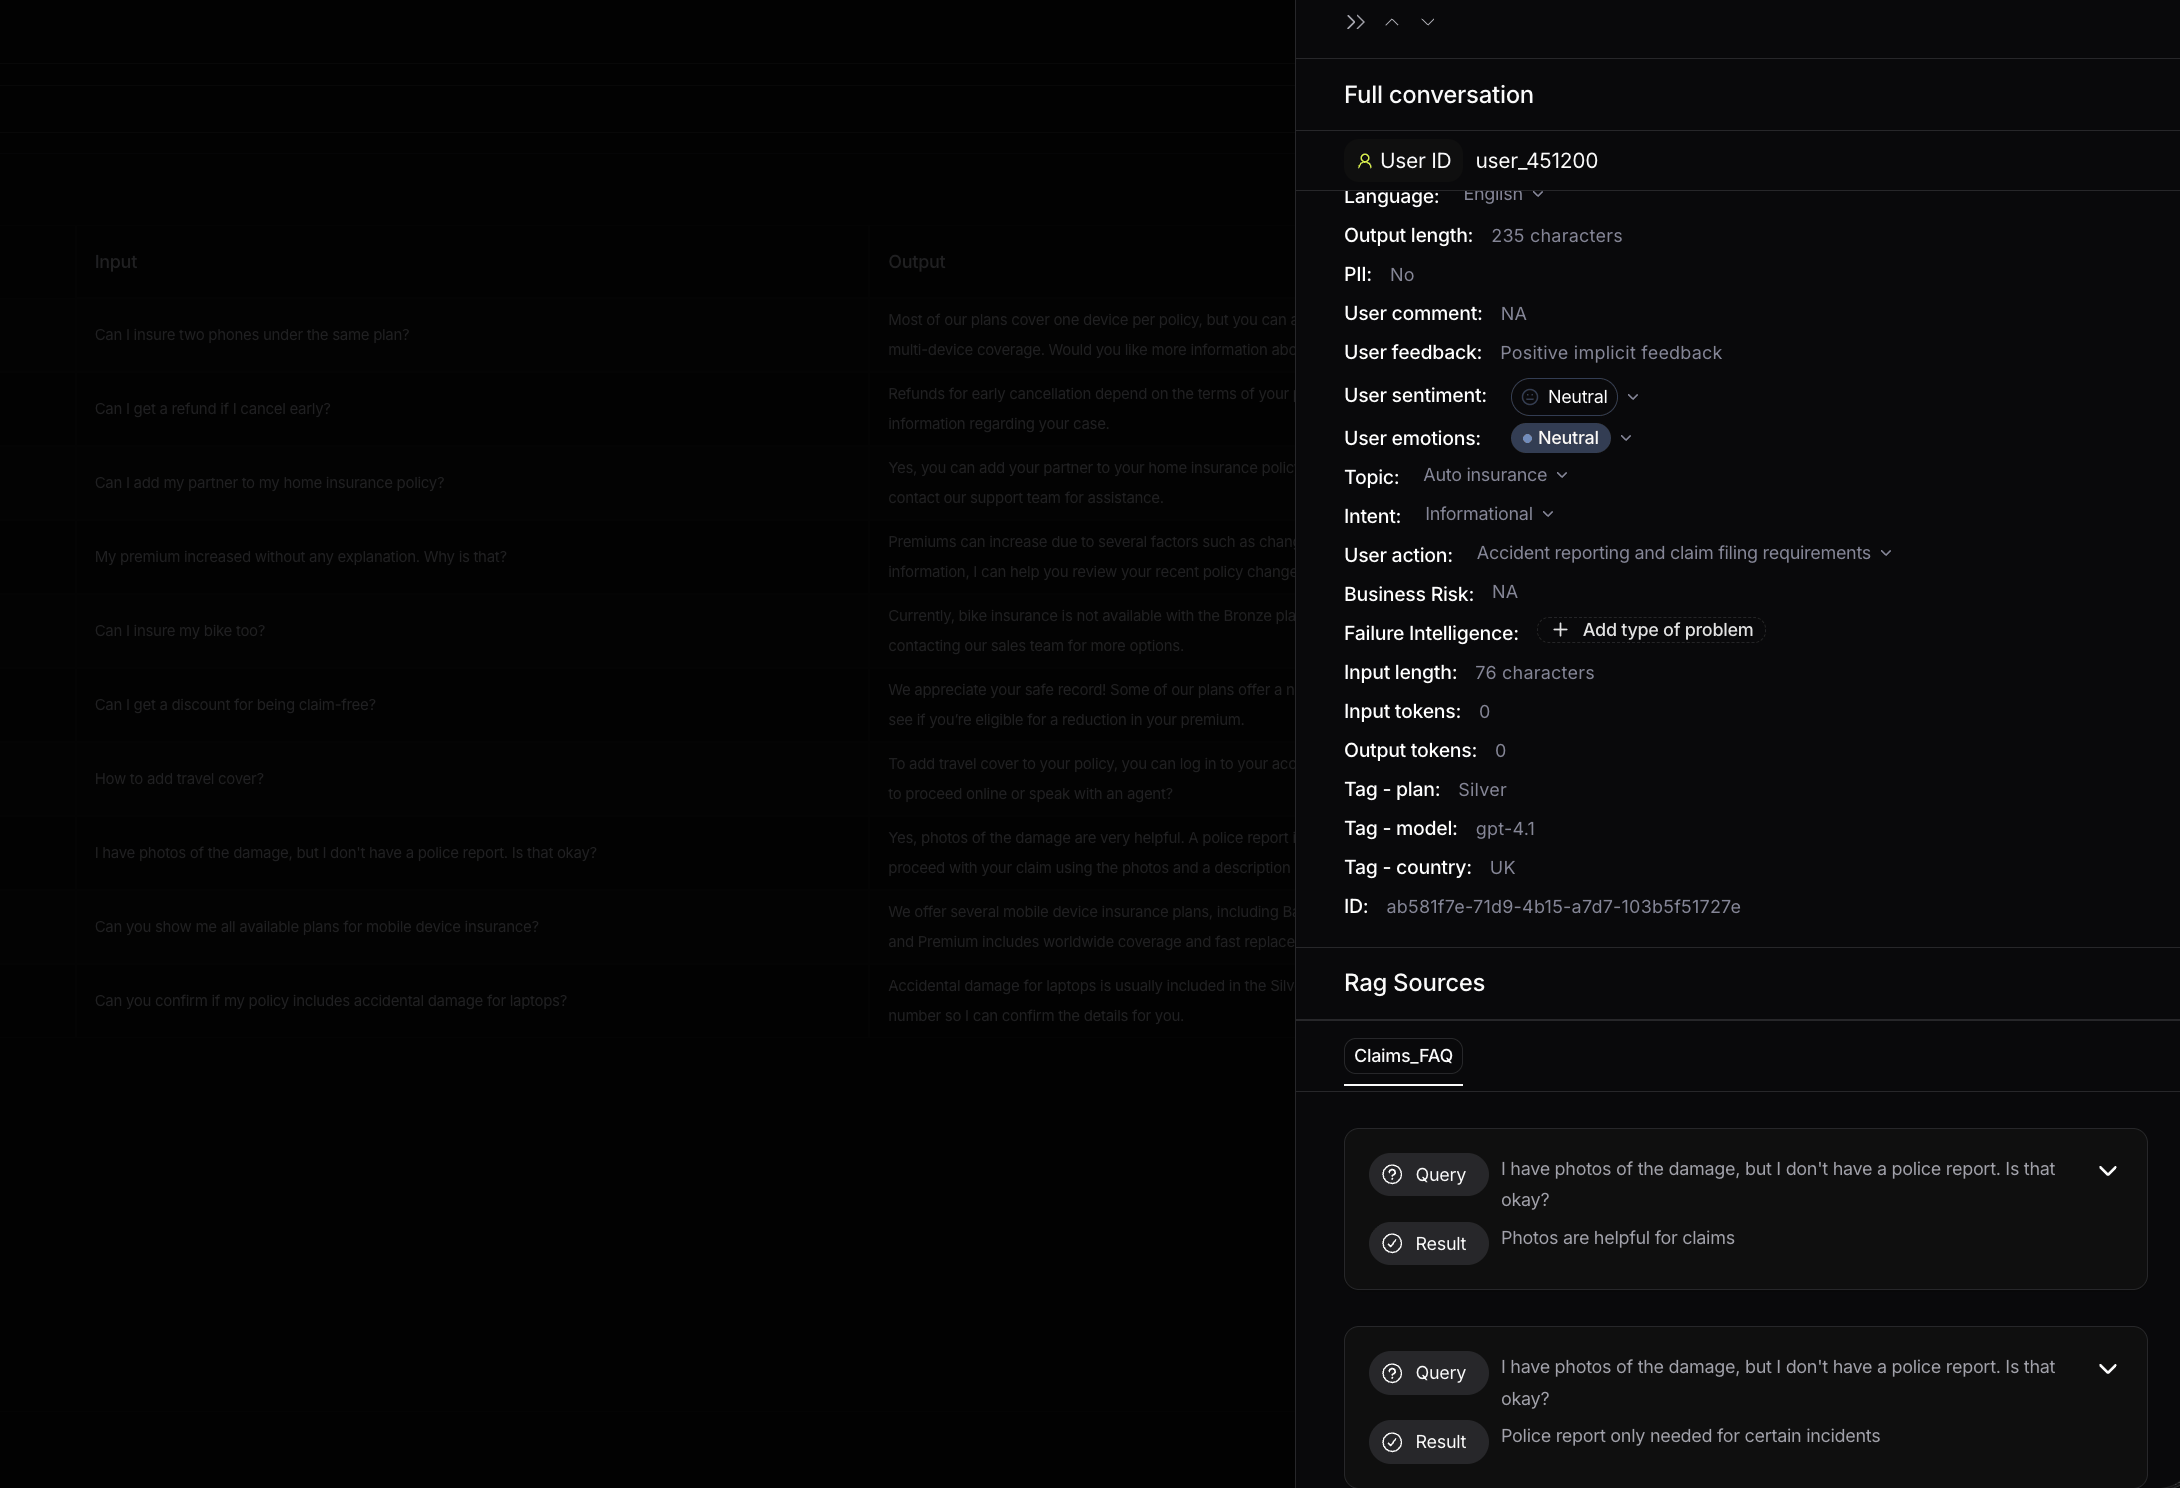
 Expand **More properties** to see everything Nebuly knows about the interaction, so you can investigate it without leaving the panel. This includes:
* **Quality and feedback signals:** user feedback, user sentiment, user emotions, and PII detection.
* **Intent and context:** the detected topic, intent, user action, and business risk.
* **Failure intelligence:** add or review the type of problem for the interaction (see [Failure Intelligence](/guides/failure-intelligence)).
* **Technical metrics:** AI cost, latency, language, input and output length, and input and output tokens.
* **Tags:** business context such as plan, model, and country (see [Enrichment and tagging](/guides/enrichment-and-tagging)), plus the interaction ID.
* **RAG sources:** the sources retrieved to generate the answer, shown as the query sent and the result returned for each source.
Expand **More properties** to see everything Nebuly knows about the interaction, so you can investigate it without leaving the panel. This includes:
* **Quality and feedback signals:** user feedback, user sentiment, user emotions, and PII detection.
* **Intent and context:** the detected topic, intent, user action, and business risk.
* **Failure intelligence:** add or review the type of problem for the interaction (see [Failure Intelligence](/guides/failure-intelligence)).
* **Technical metrics:** AI cost, latency, language, input and output length, and input and output tokens.
* **Tags:** business context such as plan, model, and country (see [Enrichment and tagging](/guides/enrichment-and-tagging)), plus the interaction ID.
* **RAG sources:** the sources retrieved to generate the answer, shown as the query sent and the result returned for each source.
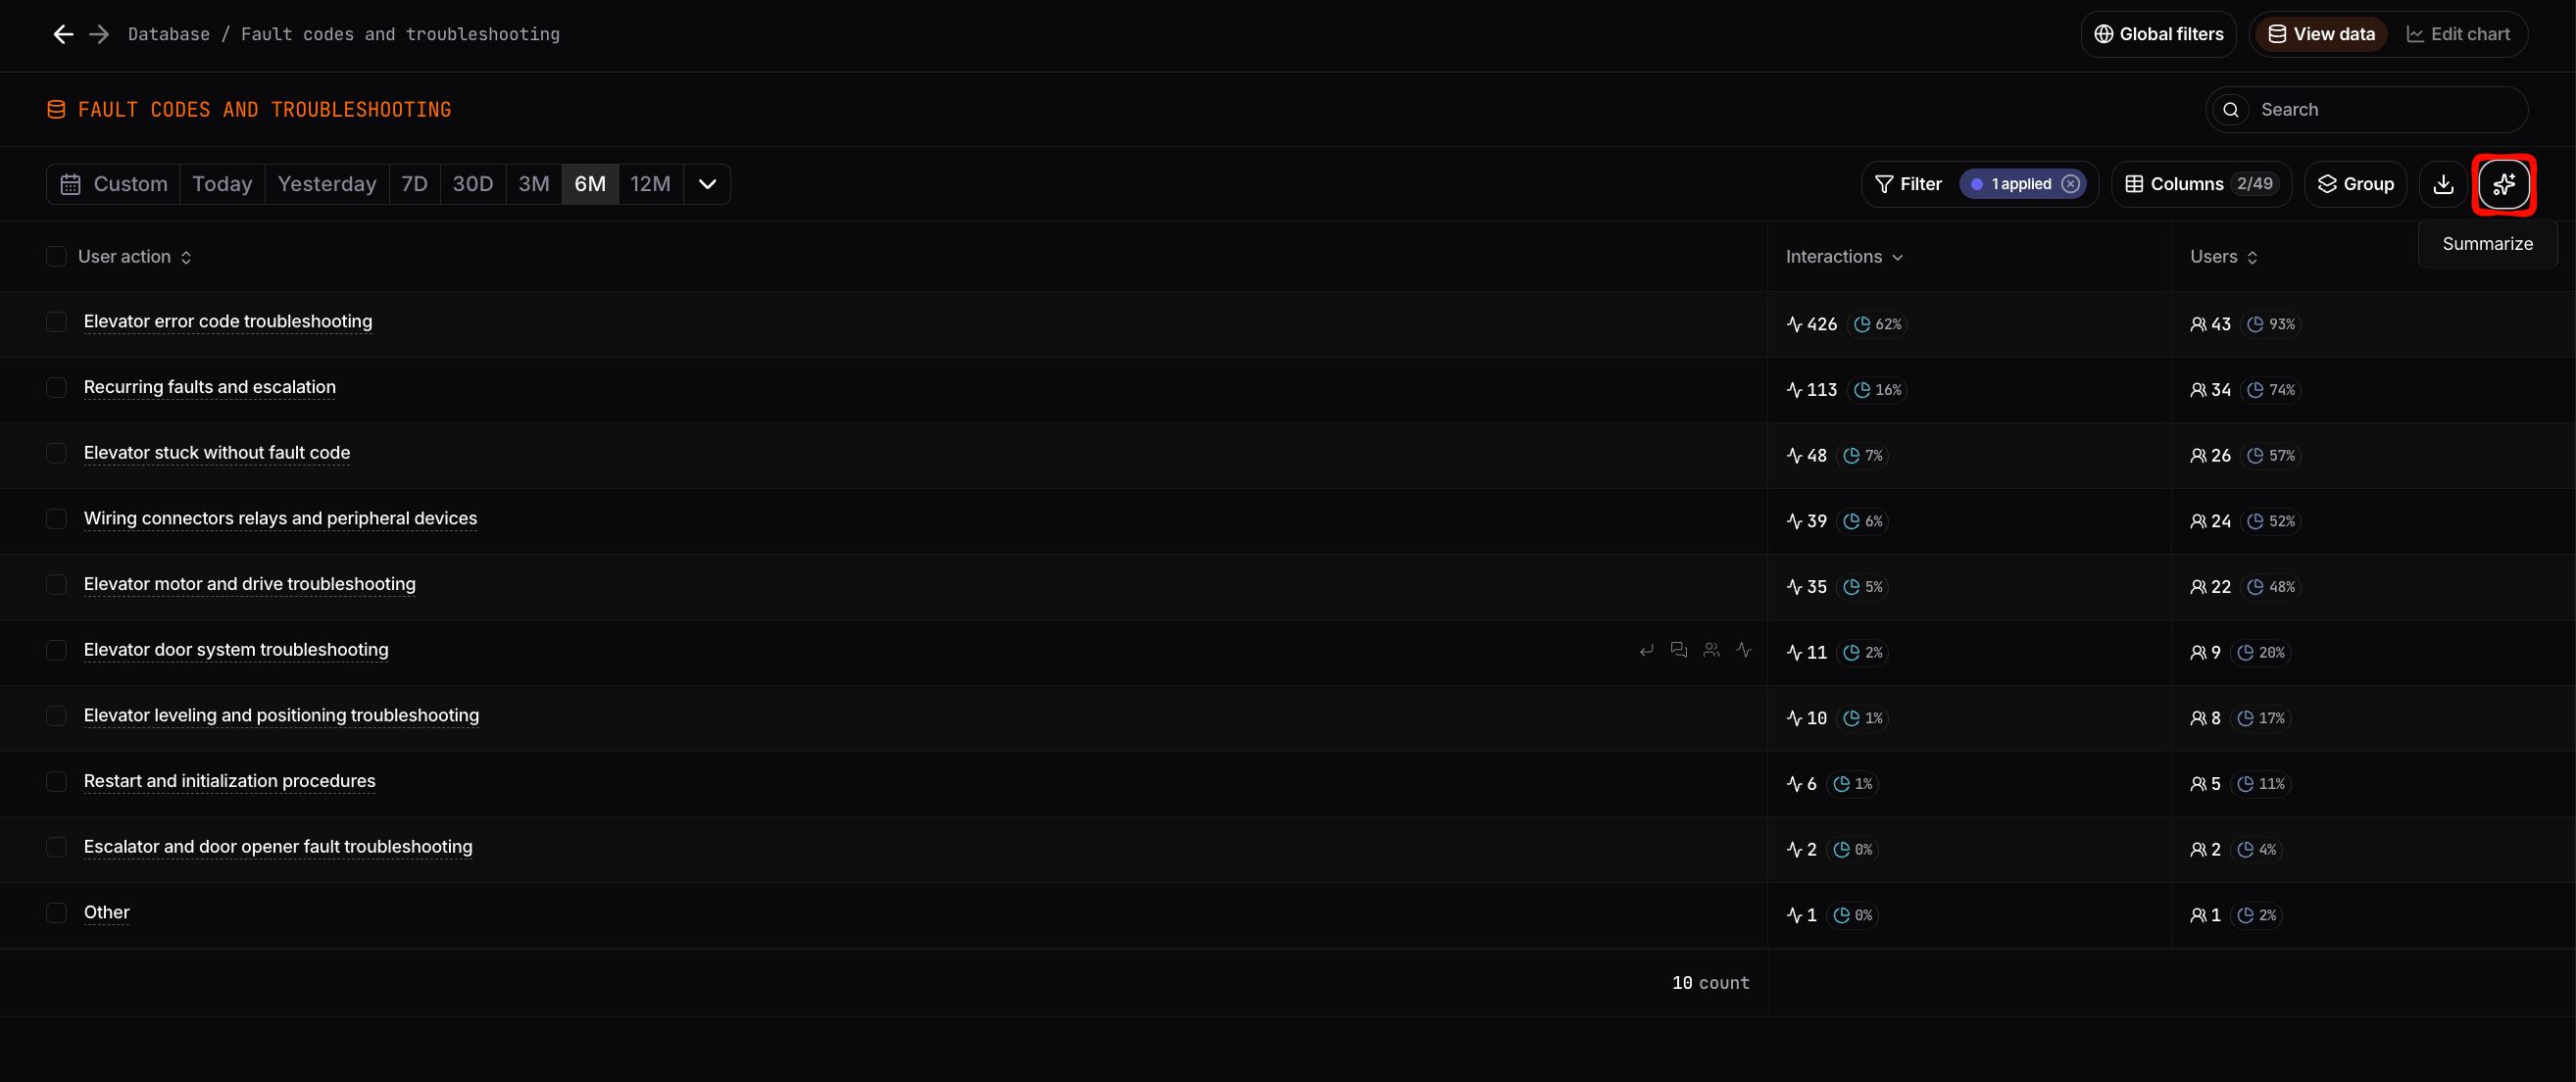
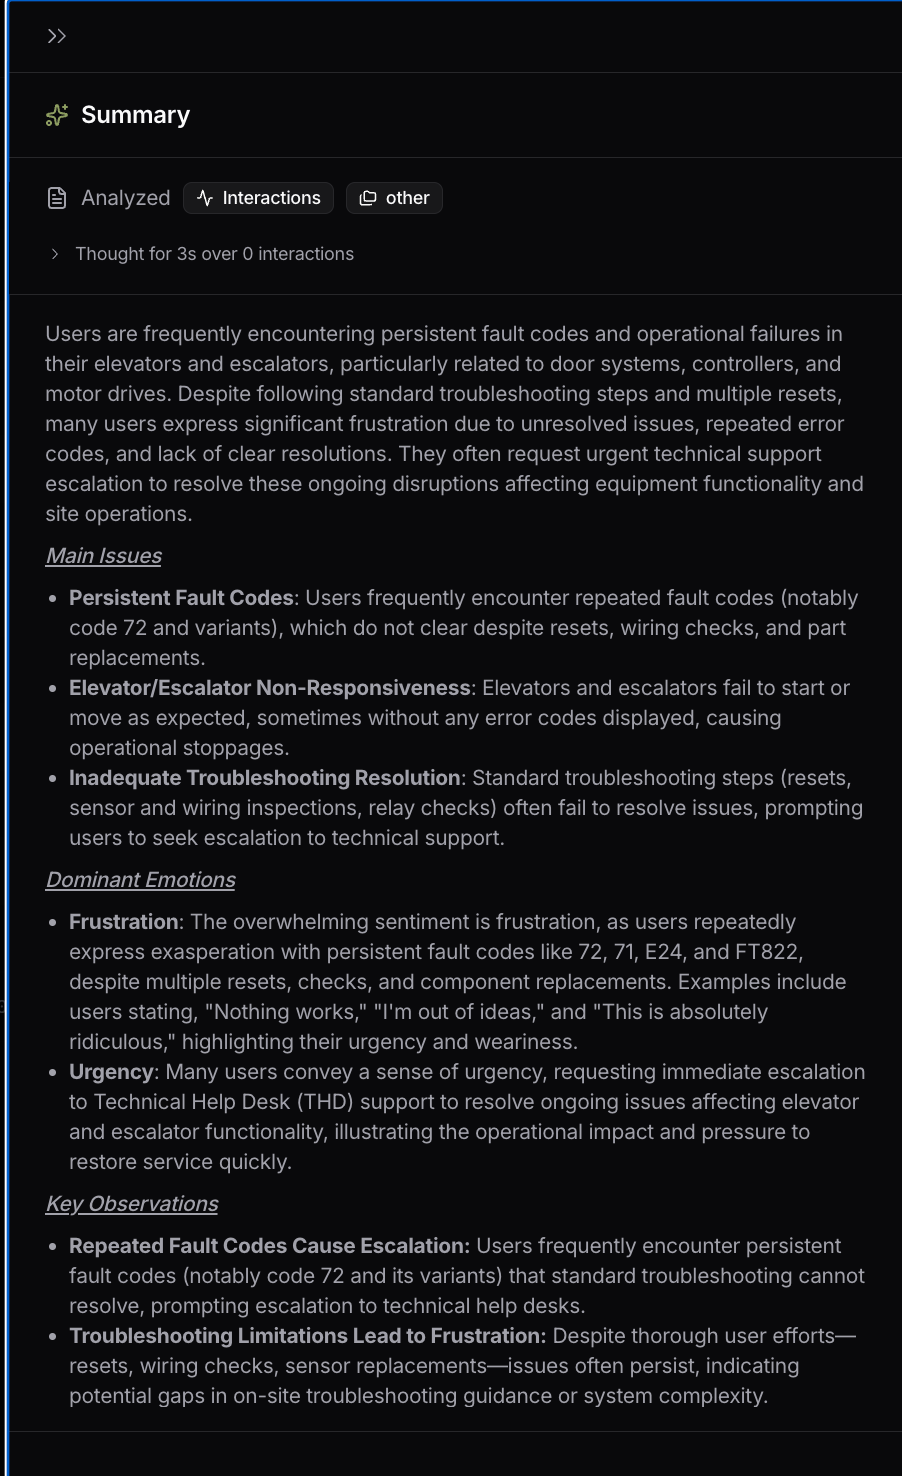
 ### Summarize
The **Summarize** button generates an AI summary of all the interactions shown in the current view. Instead of reading each interaction one by one, you get an overview of what users are doing and the common problems behind the interactions on screen, which is a fast way to understand a topic, a filtered slice, or any group you are investigating.
It works on any table or list view. The button needs at least **5 interactions** in the view to generate a summary, so narrow your filters until you have enough data.
### Summarize
The **Summarize** button generates an AI summary of all the interactions shown in the current view. Instead of reading each interaction one by one, you get an overview of what users are doing and the common problems behind the interactions on screen, which is a fast way to understand a topic, a filtered slice, or any group you are investigating.
It works on any table or list view. The button needs at least **5 interactions** in the view to generate a summary, so narrow your filters until you have enough data.
 ## Filtering
Filters let you narrow the data to exactly what you want to see. There are two levels:
* **Global filters** in the top bar, which apply across the whole platform and persist as you navigate.
* **Local filters** inside a chart or table, which apply only to that view.
You can apply one or more filters at the same time, and Nebuly supports **100+ filter options**. For the full list of fields, keyword search, and saved filter sets, see [Filtering](/guides/filtering).
## Guided tour and Help
The first time you open Nebuly, a **Welcome banner** introduces the reports interface. A step-by-step product tour walks you through the Reports and Live Data tabs, the report sections, the Reports Library, access control, Explore Mode, chart quick actions, and the report creation wizard.
You can replay the tour at any time from the persistent **Help** button.
## Filtering
Filters let you narrow the data to exactly what you want to see. There are two levels:
* **Global filters** in the top bar, which apply across the whole platform and persist as you navigate.
* **Local filters** inside a chart or table, which apply only to that view.
You can apply one or more filters at the same time, and Nebuly supports **100+ filter options**. For the full list of fields, keyword search, and saved filter sets, see [Filtering](/guides/filtering).
## Guided tour and Help
The first time you open Nebuly, a **Welcome banner** introduces the reports interface. A step-by-step product tour walks you through the Reports and Live Data tabs, the report sections, the Reports Library, access control, Explore Mode, chart quick actions, and the report creation wizard.
You can replay the tour at any time from the persistent **Help** button.