> ## Documentation Index
> Fetch the complete documentation index at: https://docs.nebuly.com/llms.txt
> Use this file to discover all available pages before exploring further.
# Reports
> Nebuly's flexible analytics dashboards: build custom views, configure charts, forecast metrics, and share results.
**Reports are Nebuly's flexible analytics dashboard.** They bring together one or more charts to help you monitor your AI product, investigate user behavior, and measure business impact over time.
A report can combine Nebuly metrics—such as error rate, time saved, business risks—with attributes from conversations, interactions, users, and custom tags. Whether you're building an executive dashboard or investigating a specific issue, reports provide a single place to organize your analysis.
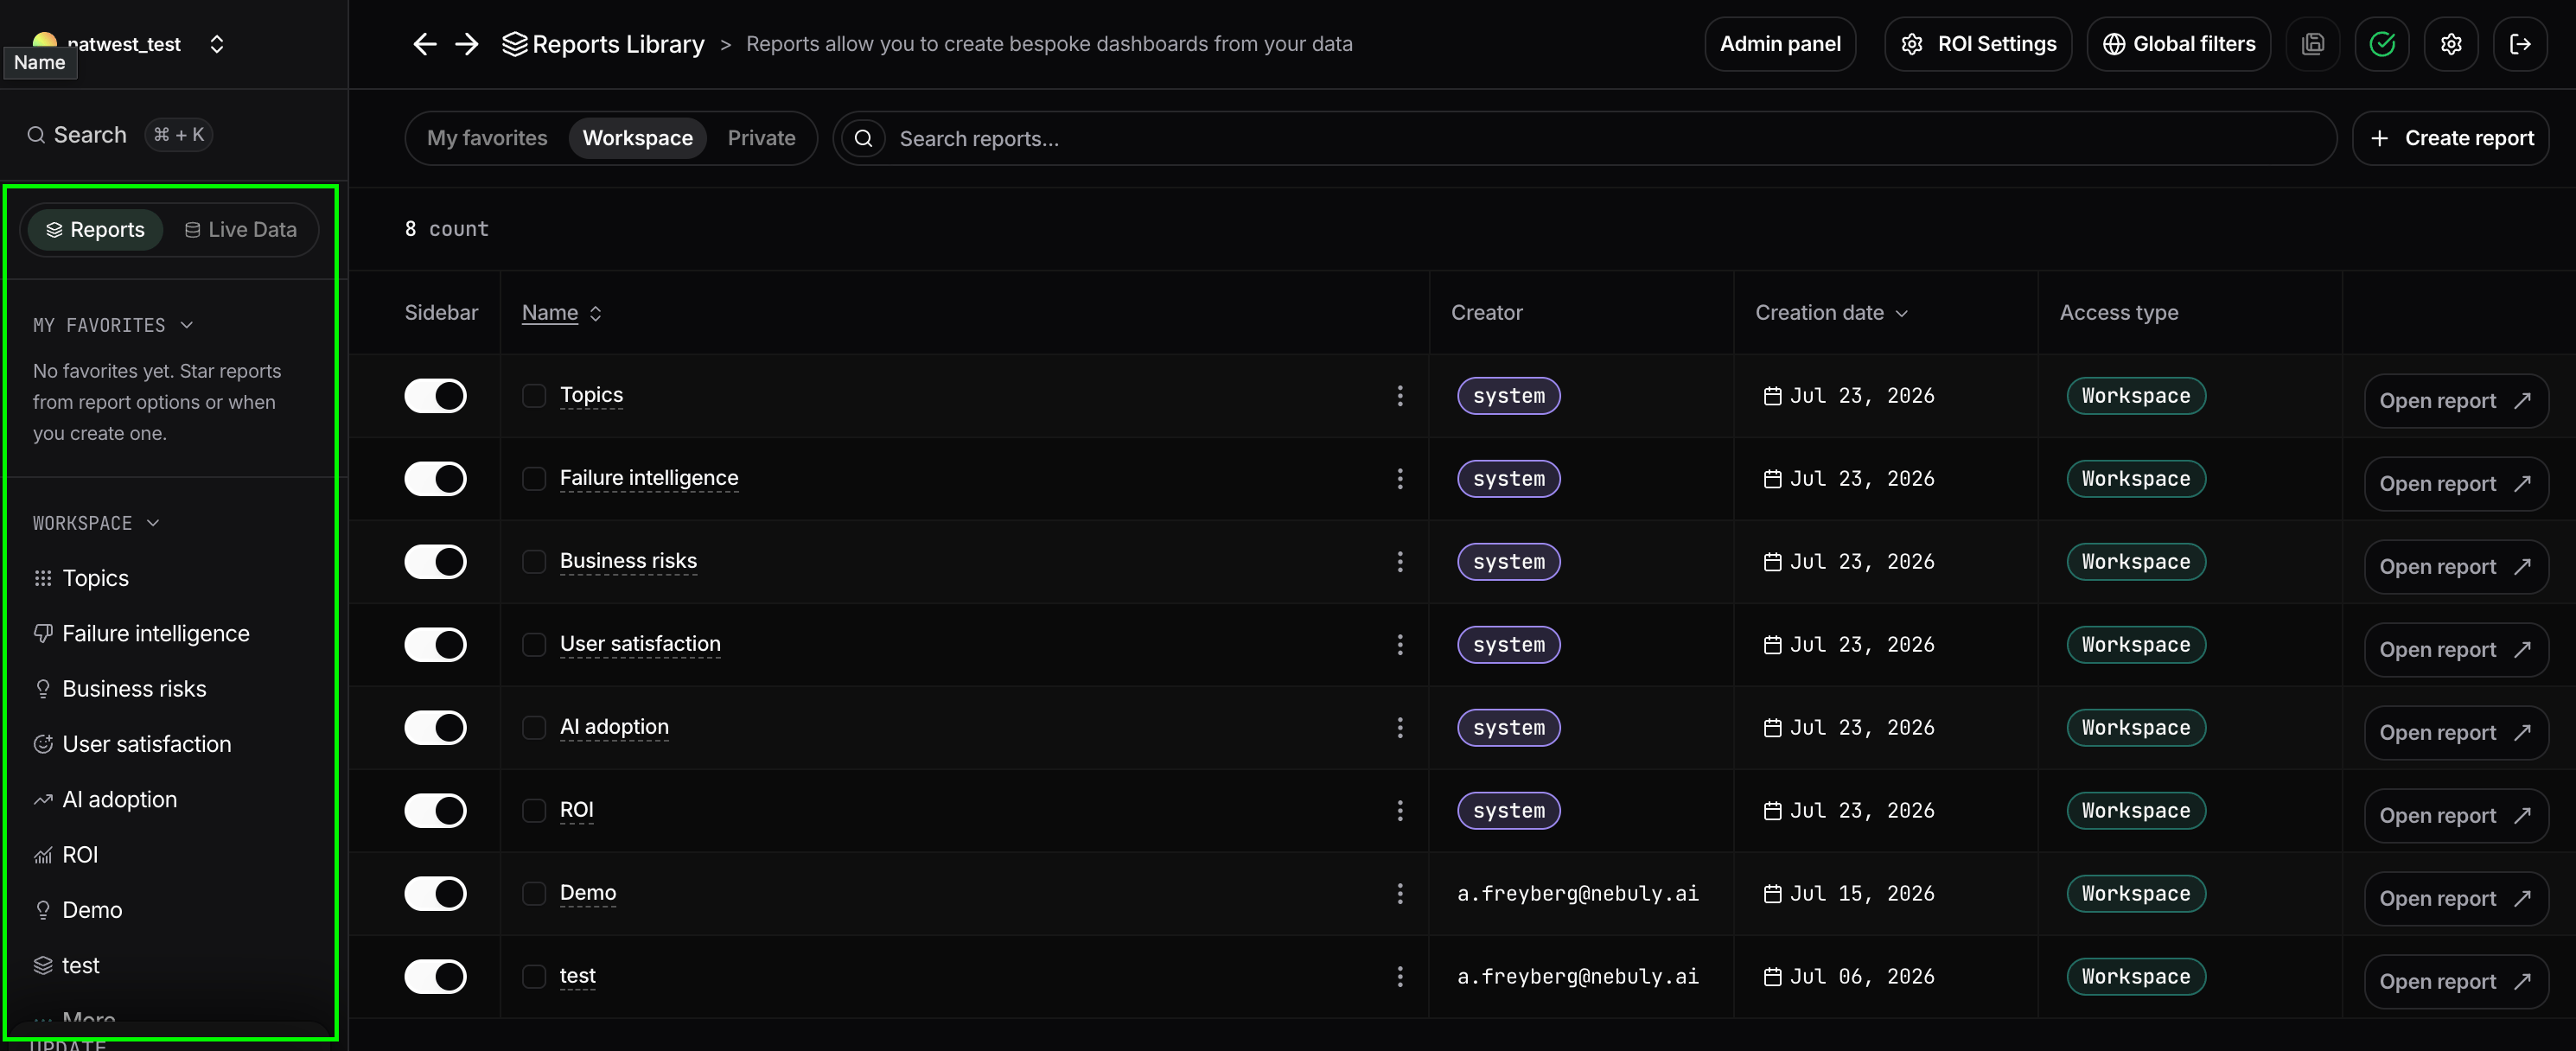
You can find all your reports in the left sidebar under the **Reports** section.
 ## Report types
Nebuly supports 2 types of report:
### System reports
System reports are built and maintained by the Nebuly team. They cover the most common analytics use cases and provide ready-to-use dashboards for monitoring AI adoption, user satisfaction, business risks, failure intelligence, ROI, and other key metrics.
These reports serve as a starting point and can be duplicated if you want to customize them (the original can't be modified).
### Custom reports
Custom reports are created by users to address specific business needs. They allow them to build dashboards tailored to their organization by combining the metrics, charts, filters, and comparisons that matter most to their use case.
Whether you're tracking a product launch, monitoring a particular customer segment, or creating an executive dashboard, custom reports give you the flexibility to organize your analysis around your own business questions.
## Organizing reports
Reports are organized into three sections in the sidebar:
* **Workspace** – reports shared with everyone who has access to the project. Use Workspace reports for dashboards your team monitors together.
* **Private** – reports visible only to you. These are useful for personal investigations, drafts, or work in progress.
* **Favorites** – quick shortcuts to reports you have starred. Favorites are personal and do not affect what other users see.
A report's visibility can be changed at any time, allowing you to move reports between your private workspace and the shared Workspace as your work evolves.
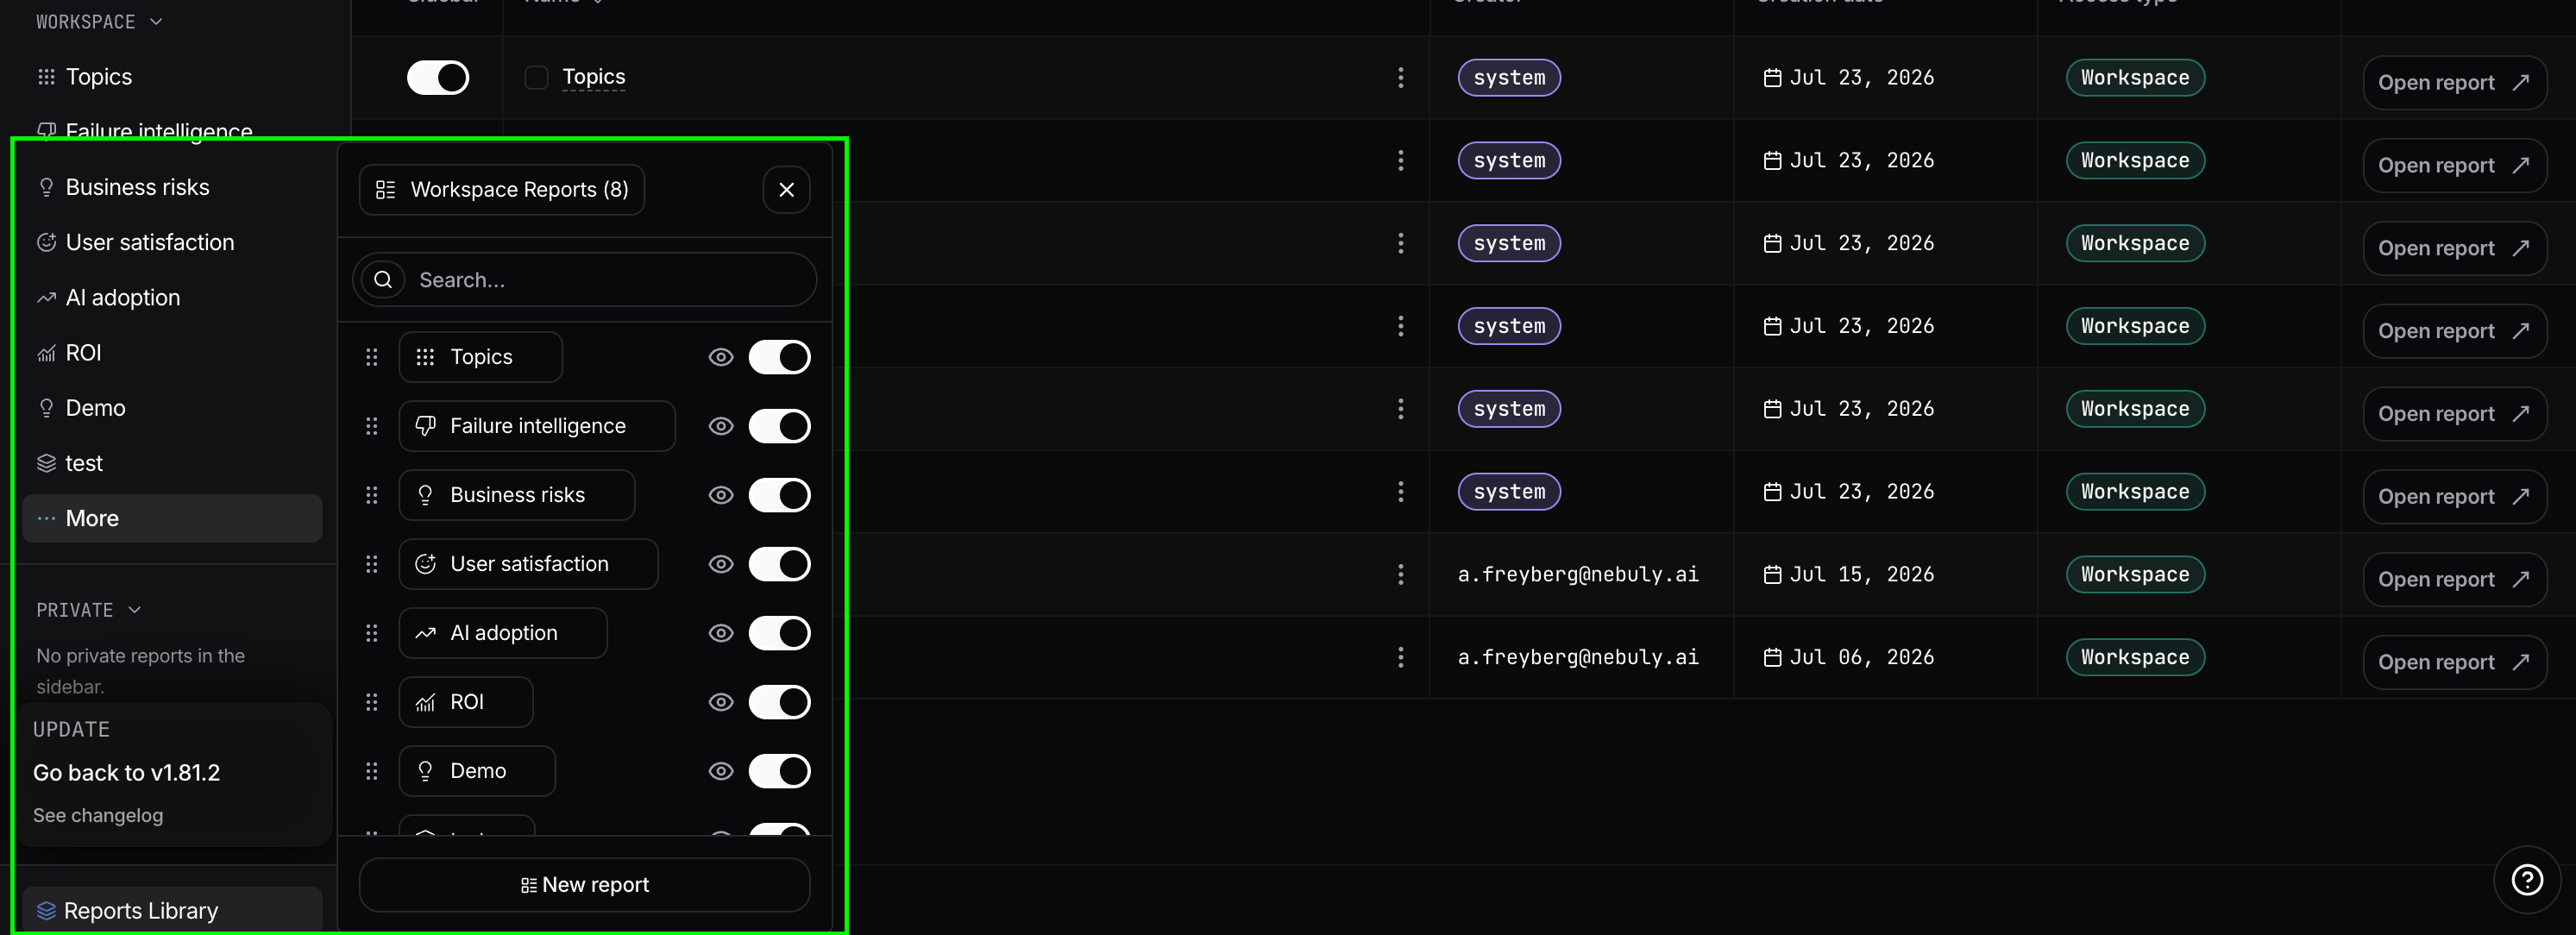
Each section (**Workspace**, **Private**, and **Favorites**) displays up to **10 reports** in the sidebar. You can choose which reports appear by changing their order or hiding them from the sidebar.
To manage the sidebar, click **More**. This opens the **Reports organization** view, where you can drag and drop reports to change their order, or use the **Sidebar** toggle to show or hide individual reports. Hidden reports remain available in the **Reports Library** and can be restored at any time.
## Report types
Nebuly supports 2 types of report:
### System reports
System reports are built and maintained by the Nebuly team. They cover the most common analytics use cases and provide ready-to-use dashboards for monitoring AI adoption, user satisfaction, business risks, failure intelligence, ROI, and other key metrics.
These reports serve as a starting point and can be duplicated if you want to customize them (the original can't be modified).
### Custom reports
Custom reports are created by users to address specific business needs. They allow them to build dashboards tailored to their organization by combining the metrics, charts, filters, and comparisons that matter most to their use case.
Whether you're tracking a product launch, monitoring a particular customer segment, or creating an executive dashboard, custom reports give you the flexibility to organize your analysis around your own business questions.
## Organizing reports
Reports are organized into three sections in the sidebar:
* **Workspace** – reports shared with everyone who has access to the project. Use Workspace reports for dashboards your team monitors together.
* **Private** – reports visible only to you. These are useful for personal investigations, drafts, or work in progress.
* **Favorites** – quick shortcuts to reports you have starred. Favorites are personal and do not affect what other users see.
A report's visibility can be changed at any time, allowing you to move reports between your private workspace and the shared Workspace as your work evolves.
Each section (**Workspace**, **Private**, and **Favorites**) displays up to **10 reports** in the sidebar. You can choose which reports appear by changing their order or hiding them from the sidebar.
To manage the sidebar, click **More**. This opens the **Reports organization** view, where you can drag and drop reports to change their order, or use the **Sidebar** toggle to show or hide individual reports. Hidden reports remain available in the **Reports Library** and can be restored at any time.
 ## Reports Library
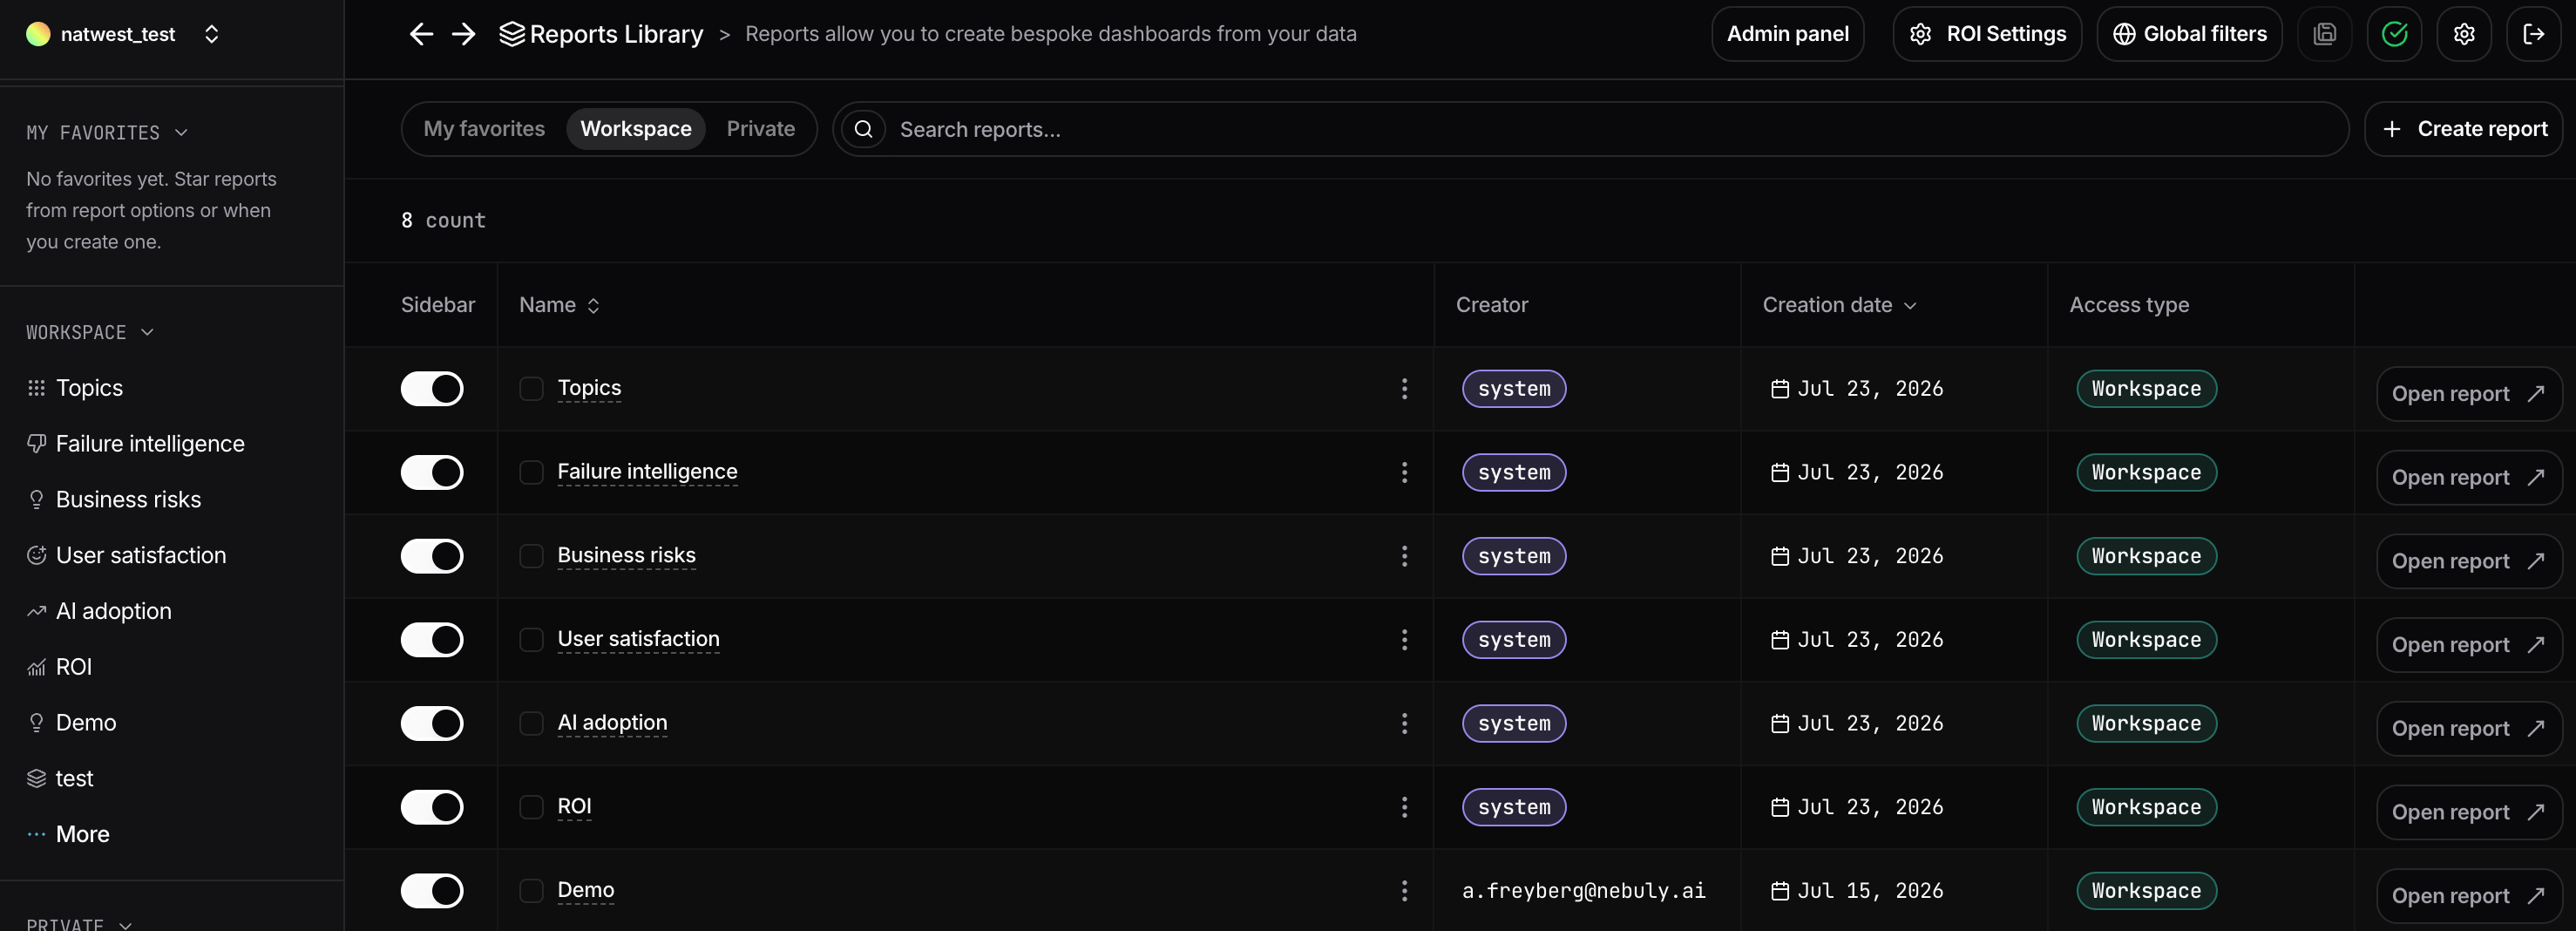
The **Reports Library** provides a complete view of every report available to you, regardless of whether it appears in the sidebar. To access the Report Library, click on "Reports Library" at the bottom of the sidebar.
From the Reports Library you can get access to more information such as:
* Browse all reports in your organization.
* Search and sort reports.
* See who created each report.
* View the report's creation date.
* Check whether a report is **Private** or part of the **Workspace**.
The library is especially useful when your organization has many reports, since only a subset of them is shown in the sidebar.
## Reports Library
The **Reports Library** provides a complete view of every report available to you, regardless of whether it appears in the sidebar. To access the Report Library, click on "Reports Library" at the bottom of the sidebar.
From the Reports Library you can get access to more information such as:
* Browse all reports in your organization.
* Search and sort reports.
* See who created each report.
* View the report's creation date.
* Check whether a report is **Private** or part of the **Workspace**.
The library is especially useful when your organization has many reports, since only a subset of them is shown in the sidebar.
 ## Report actions
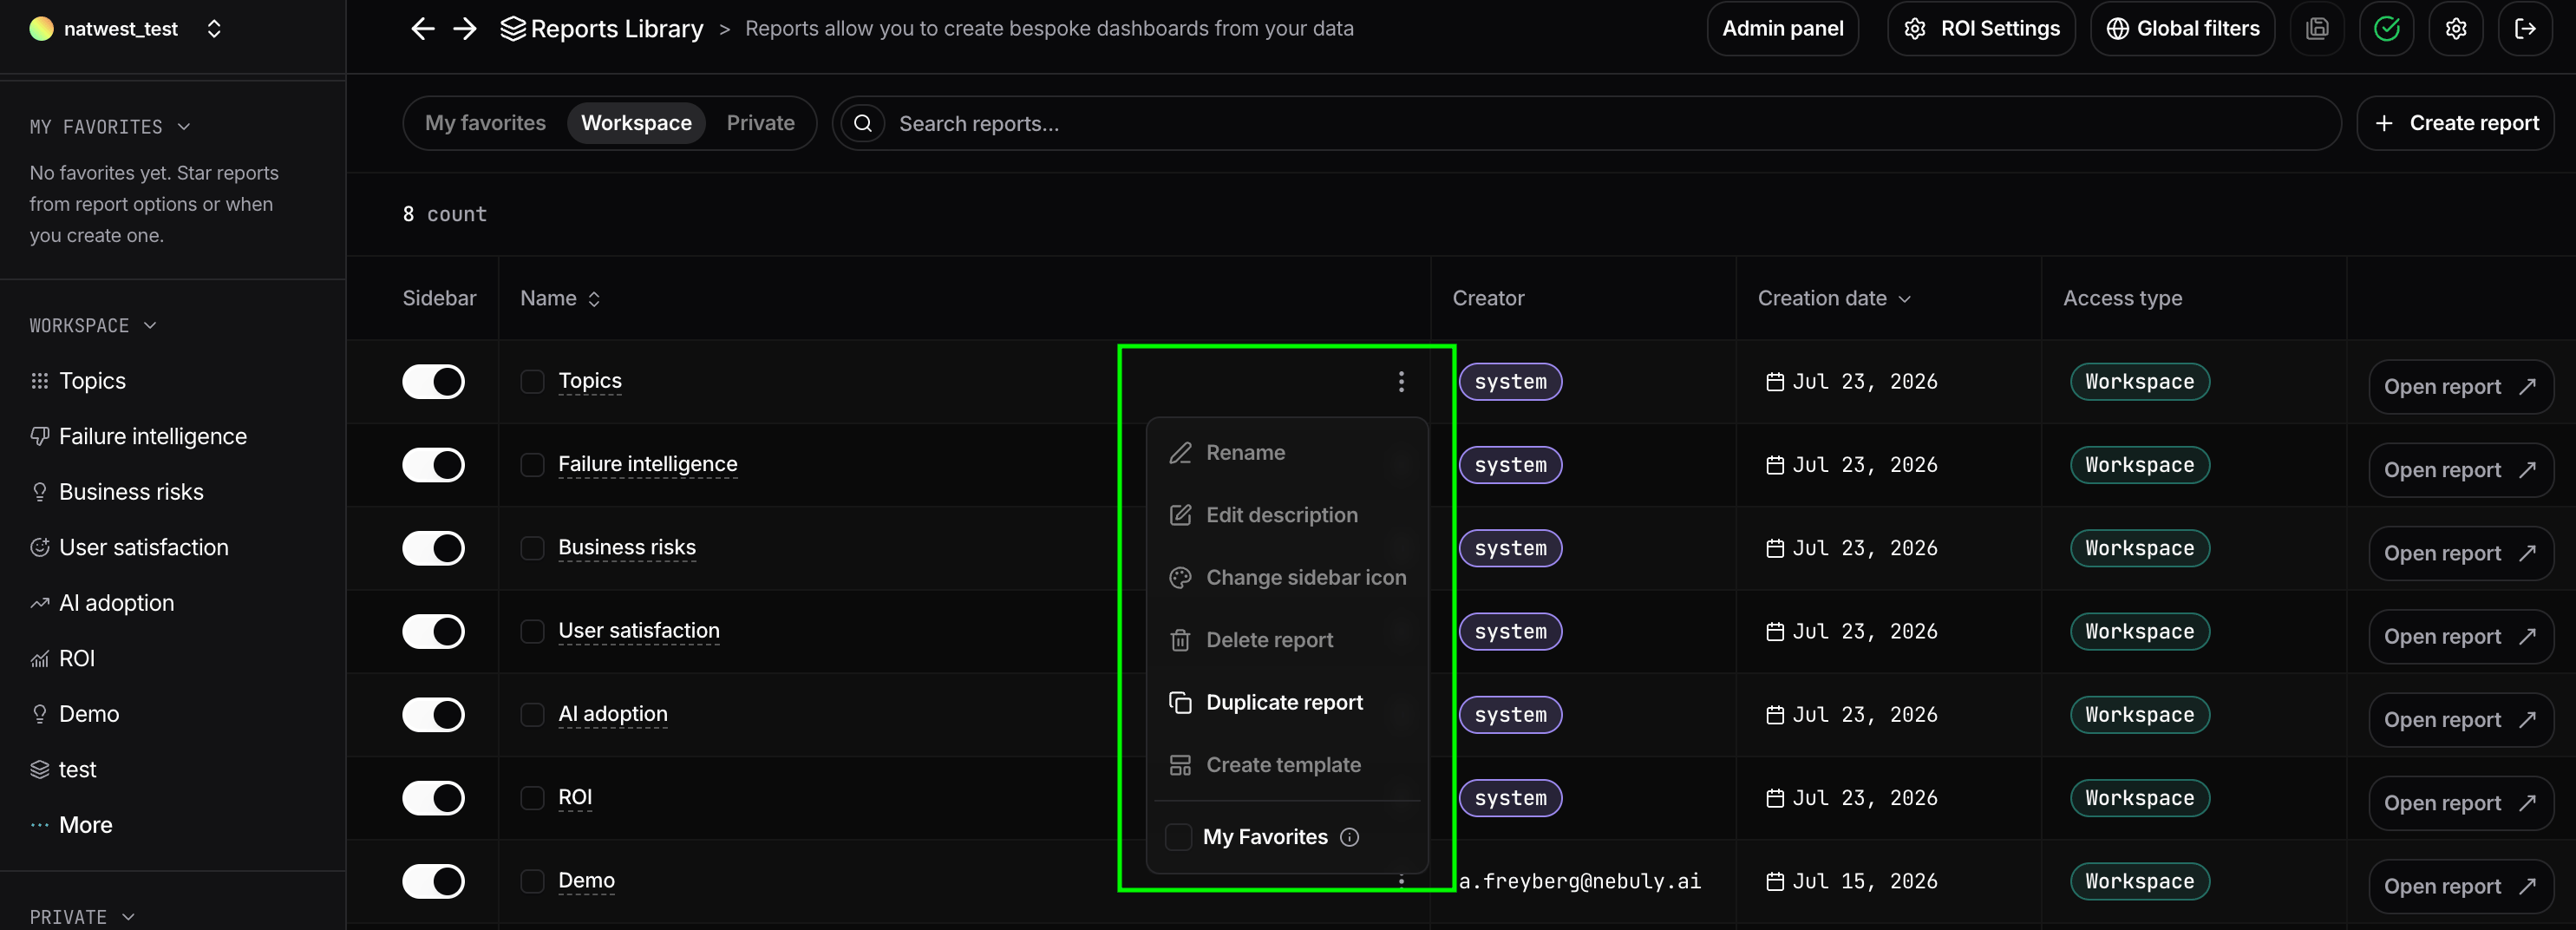
Each report provides additional management options from the **⋮** menu.
Available actions include:
* **Edit** to update the report's name, provide additional context, and customize how it appears in the sidebar.
* **Add to Favorites** or **Make Private** to change how the report is organized and who can access it.
* **Create template** to save the report as a reusable starting point that other team members can use to create new reports.
* **Duplicate** to create a copy of the report for further customization without modifying the original.
* **Delete** to permanently remove the report.
These actions help you organize, share, and maintain reports without affecting the charts and analysis they contain.
## Report actions
Each report provides additional management options from the **⋮** menu.
Available actions include:
* **Edit** to update the report's name, provide additional context, and customize how it appears in the sidebar.
* **Add to Favorites** or **Make Private** to change how the report is organized and who can access it.
* **Create template** to save the report as a reusable starting point that other team members can use to create new reports.
* **Duplicate** to create a copy of the report for further customization without modifying the original.
* **Delete** to permanently remove the report.
These actions help you organize, share, and maintain reports without affecting the charts and analysis they contain.
 Learn [**here**](/guides/reports/create-reports) how to create and manage your reports.