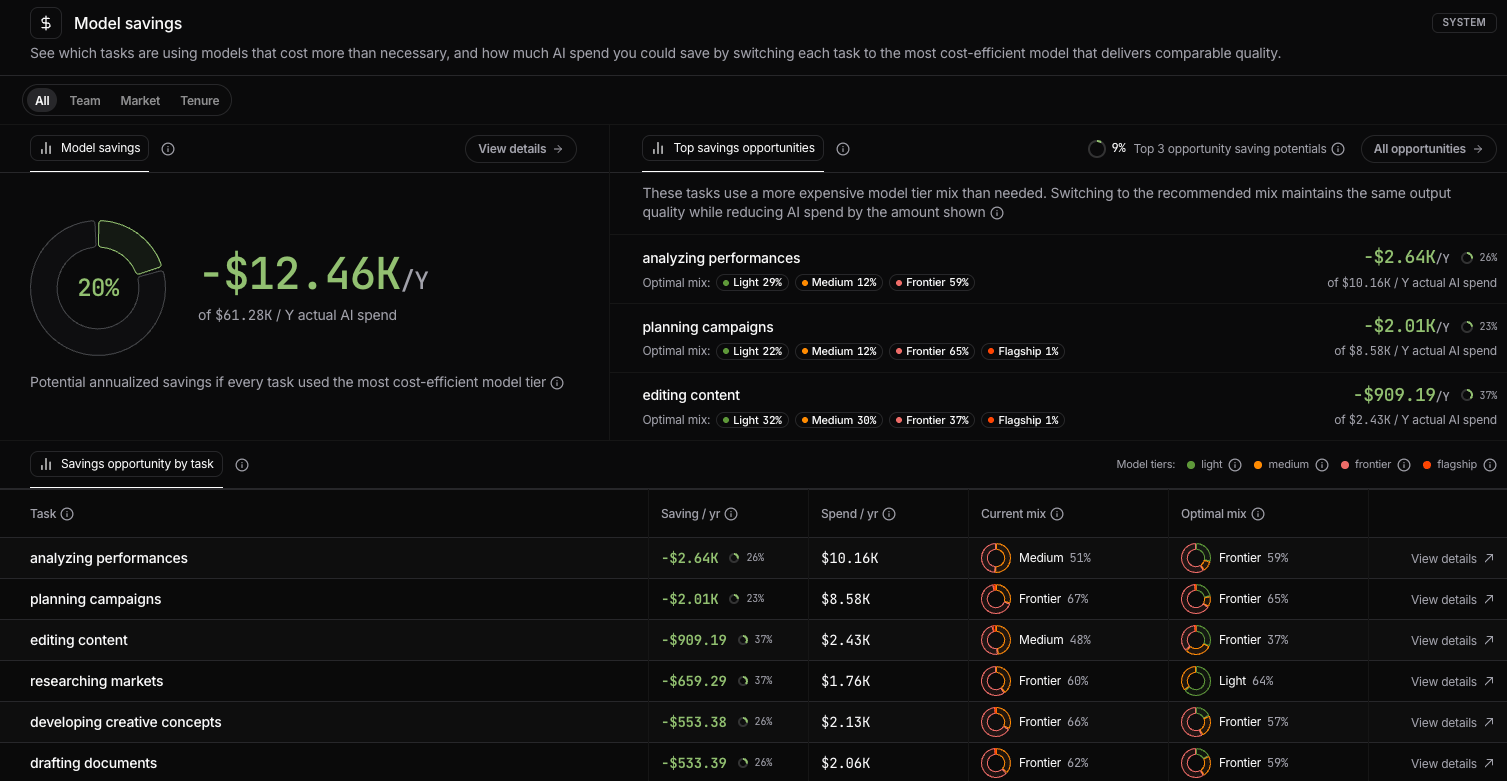
 Most organizations send every request to the same powerful model, regardless of the task. A quick email rewrite does not need the same model as a multi-step financial analysis, but it often gets routed and billed the same way.
Nebuly analyzes usage **one interaction at a time** over a **rolling 30-day window**. This window gives you an up-to-date snapshot of how your organization or teams are currently using AI.
As new interactions are added and older ones fall outside the 30-day window, the analysis updates to reflect your latest usage patterns.
Nebuly then uses those interactions to identify where a different model could handle the same work more efficiently.
1. **Reviews each interaction.** Nebuly looks at what the user asked for and what the model returned.
2. **Estimates its complexity.** Each interaction gets a complexity score based on how hard the request was, for example how much reasoning, context, or specialized knowledge it needed.
3. **Forecasts the best-fit model.** Using that score, Nebuly predicts the cheapest model tier that would have produced the same output quality.
4. **Calculates the savings.** Nebuly reprices each interaction at that model's catalog price, compares it with what you actually paid, and adds up the difference by task over a full year.
Because the estimate is built from your real interactions, the recommendation reflects how your people actually use AI, not a generic benchmark.
### Model tiers
Every model is placed in one of four tiers, from cheapest to most expensive:
Most organizations send every request to the same powerful model, regardless of the task. A quick email rewrite does not need the same model as a multi-step financial analysis, but it often gets routed and billed the same way.
Nebuly analyzes usage **one interaction at a time** over a **rolling 30-day window**. This window gives you an up-to-date snapshot of how your organization or teams are currently using AI.
As new interactions are added and older ones fall outside the 30-day window, the analysis updates to reflect your latest usage patterns.
Nebuly then uses those interactions to identify where a different model could handle the same work more efficiently.
1. **Reviews each interaction.** Nebuly looks at what the user asked for and what the model returned.
2. **Estimates its complexity.** Each interaction gets a complexity score based on how hard the request was, for example how much reasoning, context, or specialized knowledge it needed.
3. **Forecasts the best-fit model.** Using that score, Nebuly predicts the cheapest model tier that would have produced the same output quality.
4. **Calculates the savings.** Nebuly reprices each interaction at that model's catalog price, compares it with what you actually paid, and adds up the difference by task over a full year.
Because the estimate is built from your real interactions, the recommendation reflects how your people actually use AI, not a generic benchmark.
### Model tiers
Every model is placed in one of four tiers, from cheapest to most expensive:
| Tier | Typical use |
|---|---|
| **Light** | Simple, short tasks such as rewording, formatting, or quick lookups |
| **Medium** | Everyday work that needs some reasoning or context |
| **Frontier** | Complex analysis, multi-step reasoning, or long context |
| **Flagship** | The most demanding tasks that need the most capable model available |
 ### Top savings opportunities
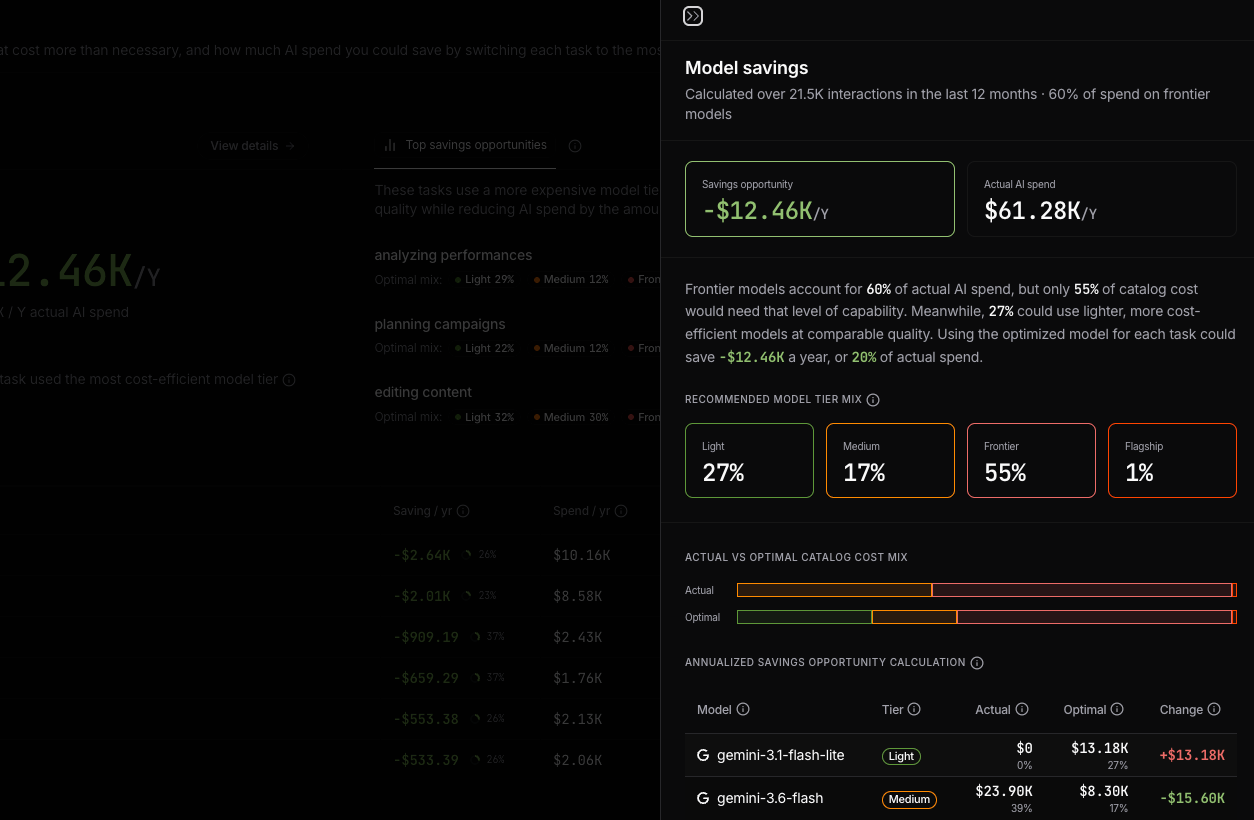
Lists the 3 tasks where switching models saves the most. Each shows the recommended mix, the annual savings, and the share of that task's spend you'd save.
The figure at the top is how much of your total AI spend those three tasks alone could save.
Click **All opportunities** to see the full ranked list, with the total savings from the top 10.
### Savings opportunity by task
Lists every task with:
### Top savings opportunities
Lists the 3 tasks where switching models saves the most. Each shows the recommended mix, the annual savings, and the share of that task's spend you'd save.
The figure at the top is how much of your total AI spend those three tasks alone could save.
Click **All opportunities** to see the full ranked list, with the total savings from the top 10.
### Savings opportunity by task
Lists every task with:
| Column | What it shows |
|---|---|
| **Saving / yr** | Annual savings from switching to the optimal mix, with the percentage of the task's spend |
| **Spend / yr** | Current annual spend on the task |
| **Current mix** | Today's tier split. The label shows the largest tier. Hover to see the full split |
| **Optimal mix** | The recommended tier split. The label shows the largest tier |