> ## Documentation Index
> Fetch the complete documentation index at: https://docs.nebuly.com/llms.txt
> Use this file to discover all available pages before exploring further.

# Upskilling

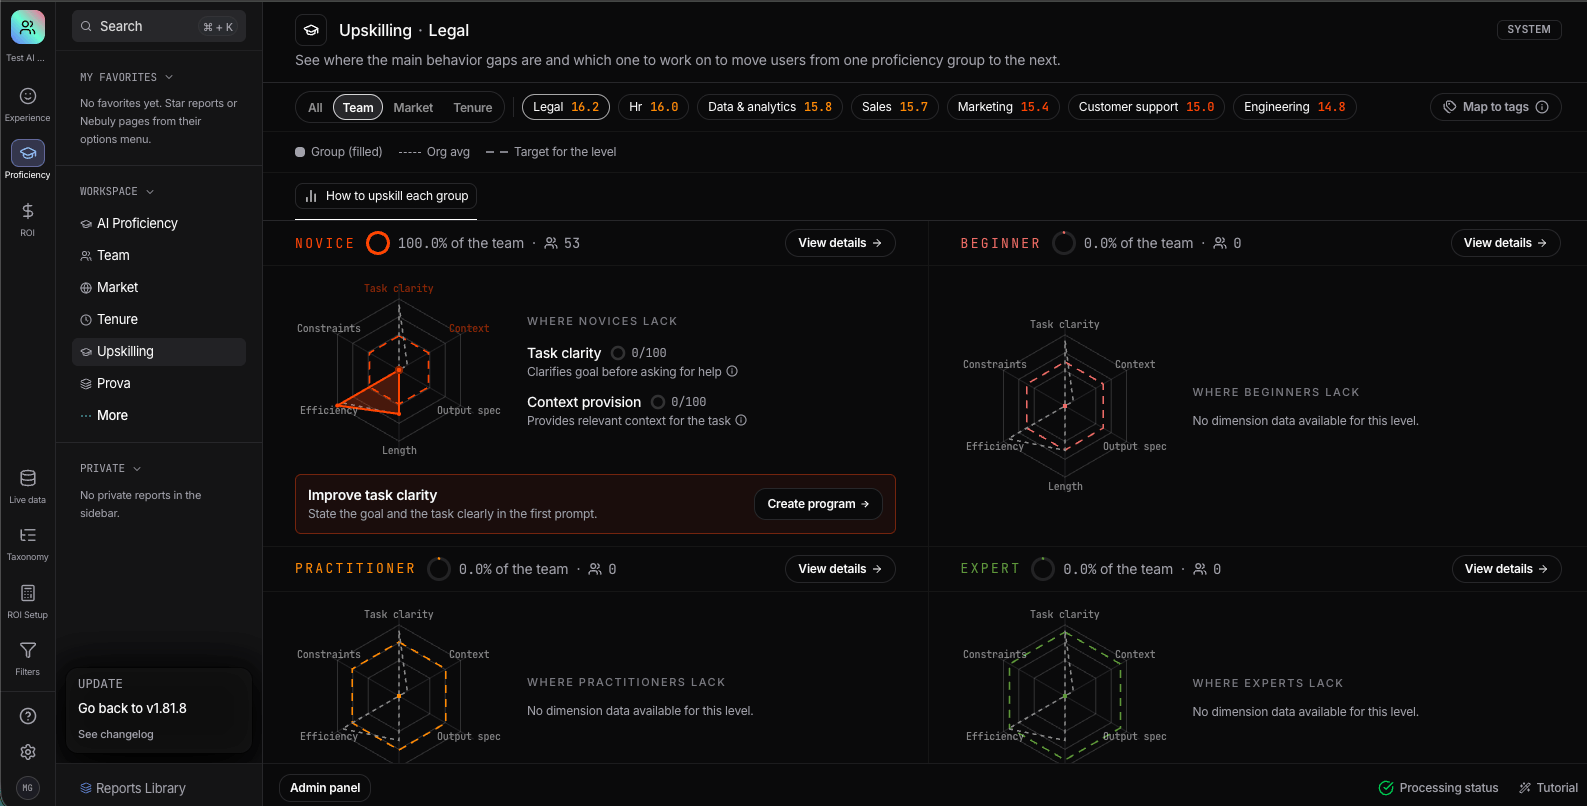
The **Upskilling** page shows how effectively people in your organization use AI, where their biggest behavior gaps are, and what each group should work on to reach the next proficiency level.

<img src="https://mintcdn.com/nebulyai/tyxr6Gd4zuVUslkl/images/image-52.png?fit=max&auto=format&n=tyxr6Gd4zuVUslkl&q=85&s=1f2e7b4e7ba9bf85d7325bb46151b4b2" alt="Image" width="1587" height="806" data-path="images/image-52.png" />

### Proficiency groups

Each user is assigned to one of four proficiency levels based on their **AI proficiency score**. This score summarizes how consistently the user demonstrates the prompting behaviors measured by Nebuly. Read more [here](/guides/analysis/ai-fluency-index) about AI score and proficiency level.

For each level, you can see how many users it contains and what share of the selected group they represent.

A user moves to the next proficiency level once they reach the **target**, the minimum score required to move up from their current level.

### The six behaviors

The proficiency score is based on six prompting behaviors, each scored from 0 to 100:

<table>
  <colgroup>
    <col width="204" />

    <col width="508" />
  </colgroup>

  <thead>
    <tr>
      <th>Behavior</th>
      <th>What it measures</th>
    </tr>
  </thead>

  <tbody>
    <tr>
      <td>**Task clarity**</td>
      <td>Clearly states the goal or task</td>
    </tr>

    <tr>
      <td>**Context provision**</td>
      <td>Provides the context needed to complete the task</td>
    </tr>

    <tr>
      <td>**Output specification**</td>
      <td>Specifies the expected format or structure</td>
    </tr>

    <tr>
      <td>**Constraint specification**</td>
      <td>States relevant constraints and requirements</td>
    </tr>

    <tr>
      <td>**Conversation efficiency**</td>
      <td>Reaches a useful answer in fewer turns</td>
    </tr>

    <tr>
      <td>**Prompt length**</td>
      <td>Provides enough detail without unnecessary information</td>
    </tr>
  </tbody>
</table>

A **behavior gap** is the difference between the current score for a behavior and its **target**, which is the minimum score that behaviors need to reach to support progression to the next proficiency level. Larger gaps indicate where there is more room to improve.

The **organization average** is the average score for that behavior across users in the organization. It gives you a reference point for comparing the performance of a level or group with the organization as a whole.

### How to upskill each group

The **How to upskill** tab contains one card for each proficiency level.

Each card includes a radar chart showing the six behaviors for that group, scored from 0 to 100:

* **Filled area**: the group's current scores
* **Dotted line**: the organization average
* **Dashed line**: the target needed to move to the next proficiency level

The chart makes it easier to see which behaviors are furthest from the target.

The **Recommended action** section identifies a behavior to work on and explains why improving it can help the group progress. Click **Create program** to turn that recommendation into a training message.

### View details

Click **View details** on any proficiency level to see the full breakdown of its behaviors.

For each behavior, you can see:

* The group's current score
* The gap between the current score and the target
* A score bar showing the target and organization average
* A **Create program** button

Behaviors with the largest gaps appear first, helping you identify where training can have the greatest effect.

### Create program

A **program** is a training message designed to help a specific group improve one prompting behavior.

Click **Create program** to generate a ready-to-send short program for a behavior and proficiency level.

Each program includes:

* **Your objective**: a concrete habit to practice
* **Why it matters**: an explanation of how the behavior affects AI usage
* **Examples**: weaker and stronger prompt examples that show how to apply the behavior

Use **Copy text** to share the program through email, Slack, or another internal communication channel.

### Promotion potential

**Promotion potential** shows which users are closest to reaching the target for the next proficiency level.

For each transition, you can see how many users are close to moving up and what share of their current level they represent:

* Novice → Beginner
* Beginner → Practitioner
* Practitioner → Expert

Use this view to identify groups where targeted training could help more users reach the next level.

### Filter the view

Use the tabs at the top of the page to analyze different groups:

* **All** shows the entire organization.
* **Team** groups users by team. Each team includes its average proficiency score. Use **Map to tags** to define which user tags belong to each team.
* **Market** groups users by market or region.
* **Tenure** groups users by how long they have been using AI tools.

The users included by the active filter are referred to as the **selected group**. Percentages and scores on the page are calculated for that group.

## Build your own reports

Upskilling metrics and dimensions are also available in Nebuly's reporting engine.

You can combine **proficiency levels**, **behavior scores**, **behavior gaps**, and user attributes with your existing filters and groupings to analyze where different groups need support.

For example, you can build reports to understand:

* Which teams have the largest proficiency gaps
* Which prompting behaviors are weakest across the organization
* How behavior scores change over time
* Which teams or user groups are closest to reaching the next proficiency level
* Whether training programs are improving the behaviors they target


This documentation is built and hosted on [Mintlify](https://mintlify.com), a developer documentation platform.