Analyitcs is a powerful and flexible tool designed to visualize trends and compositions within your data. You can analyze users, interactions, and user cost profiles, and display the data in a wide variety of chart types.
Here are some of the sample questions you can answer in Analyitcs:
-
Users
- How often are my users getting value from the LLM answers?
- Why are my users not getting value?
- Which actions are my users asking the LLM to perform?
-
Interactions
- How many messages were sent over the last 30 days?
- How many messages were sent by dissatified users?
-
Cost
- How much does it cost to serve my users?
- How much do waste costs account for?
-
Latency
- How is latency affecting my users?
Quick start
Building a chart inAnalyitcs takes just a few clicks, and results arrive in seconds. Let’s see how.
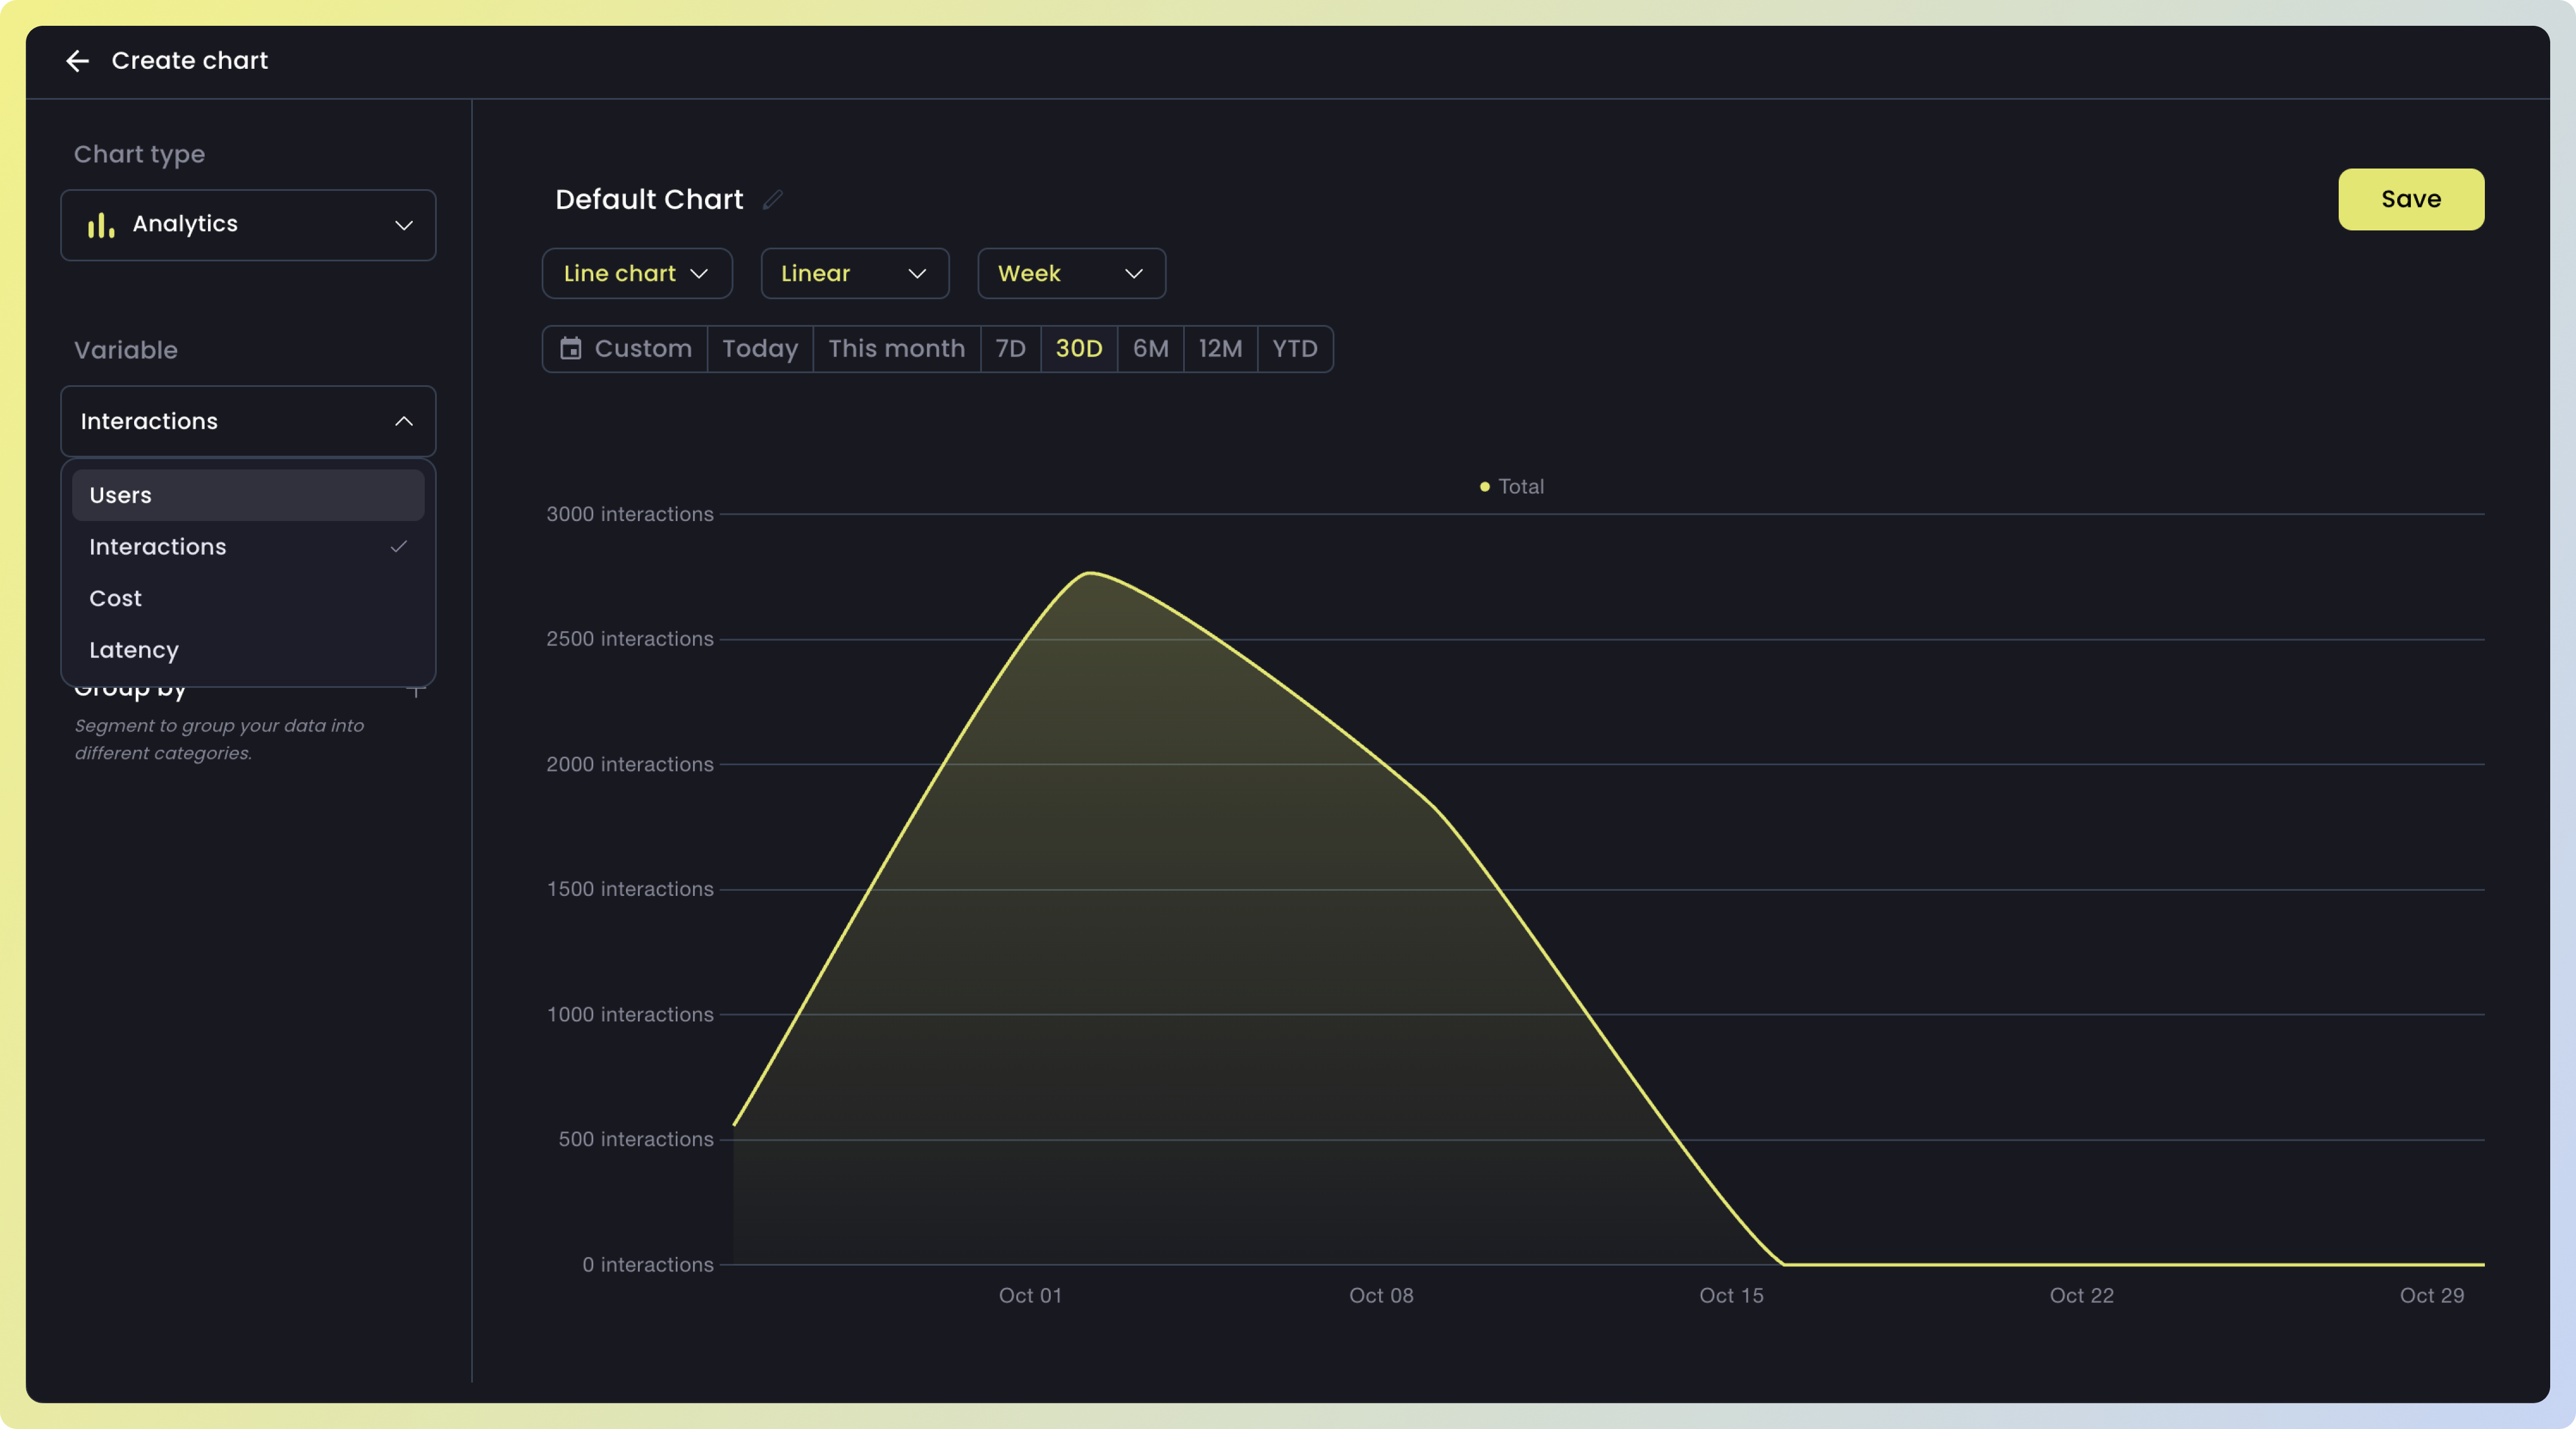
Step 1: Choose variable
Users, Interactions, Cost or Latency can be the basic building block of an Analytics chart. You can choose one of these variables to start building your chart.
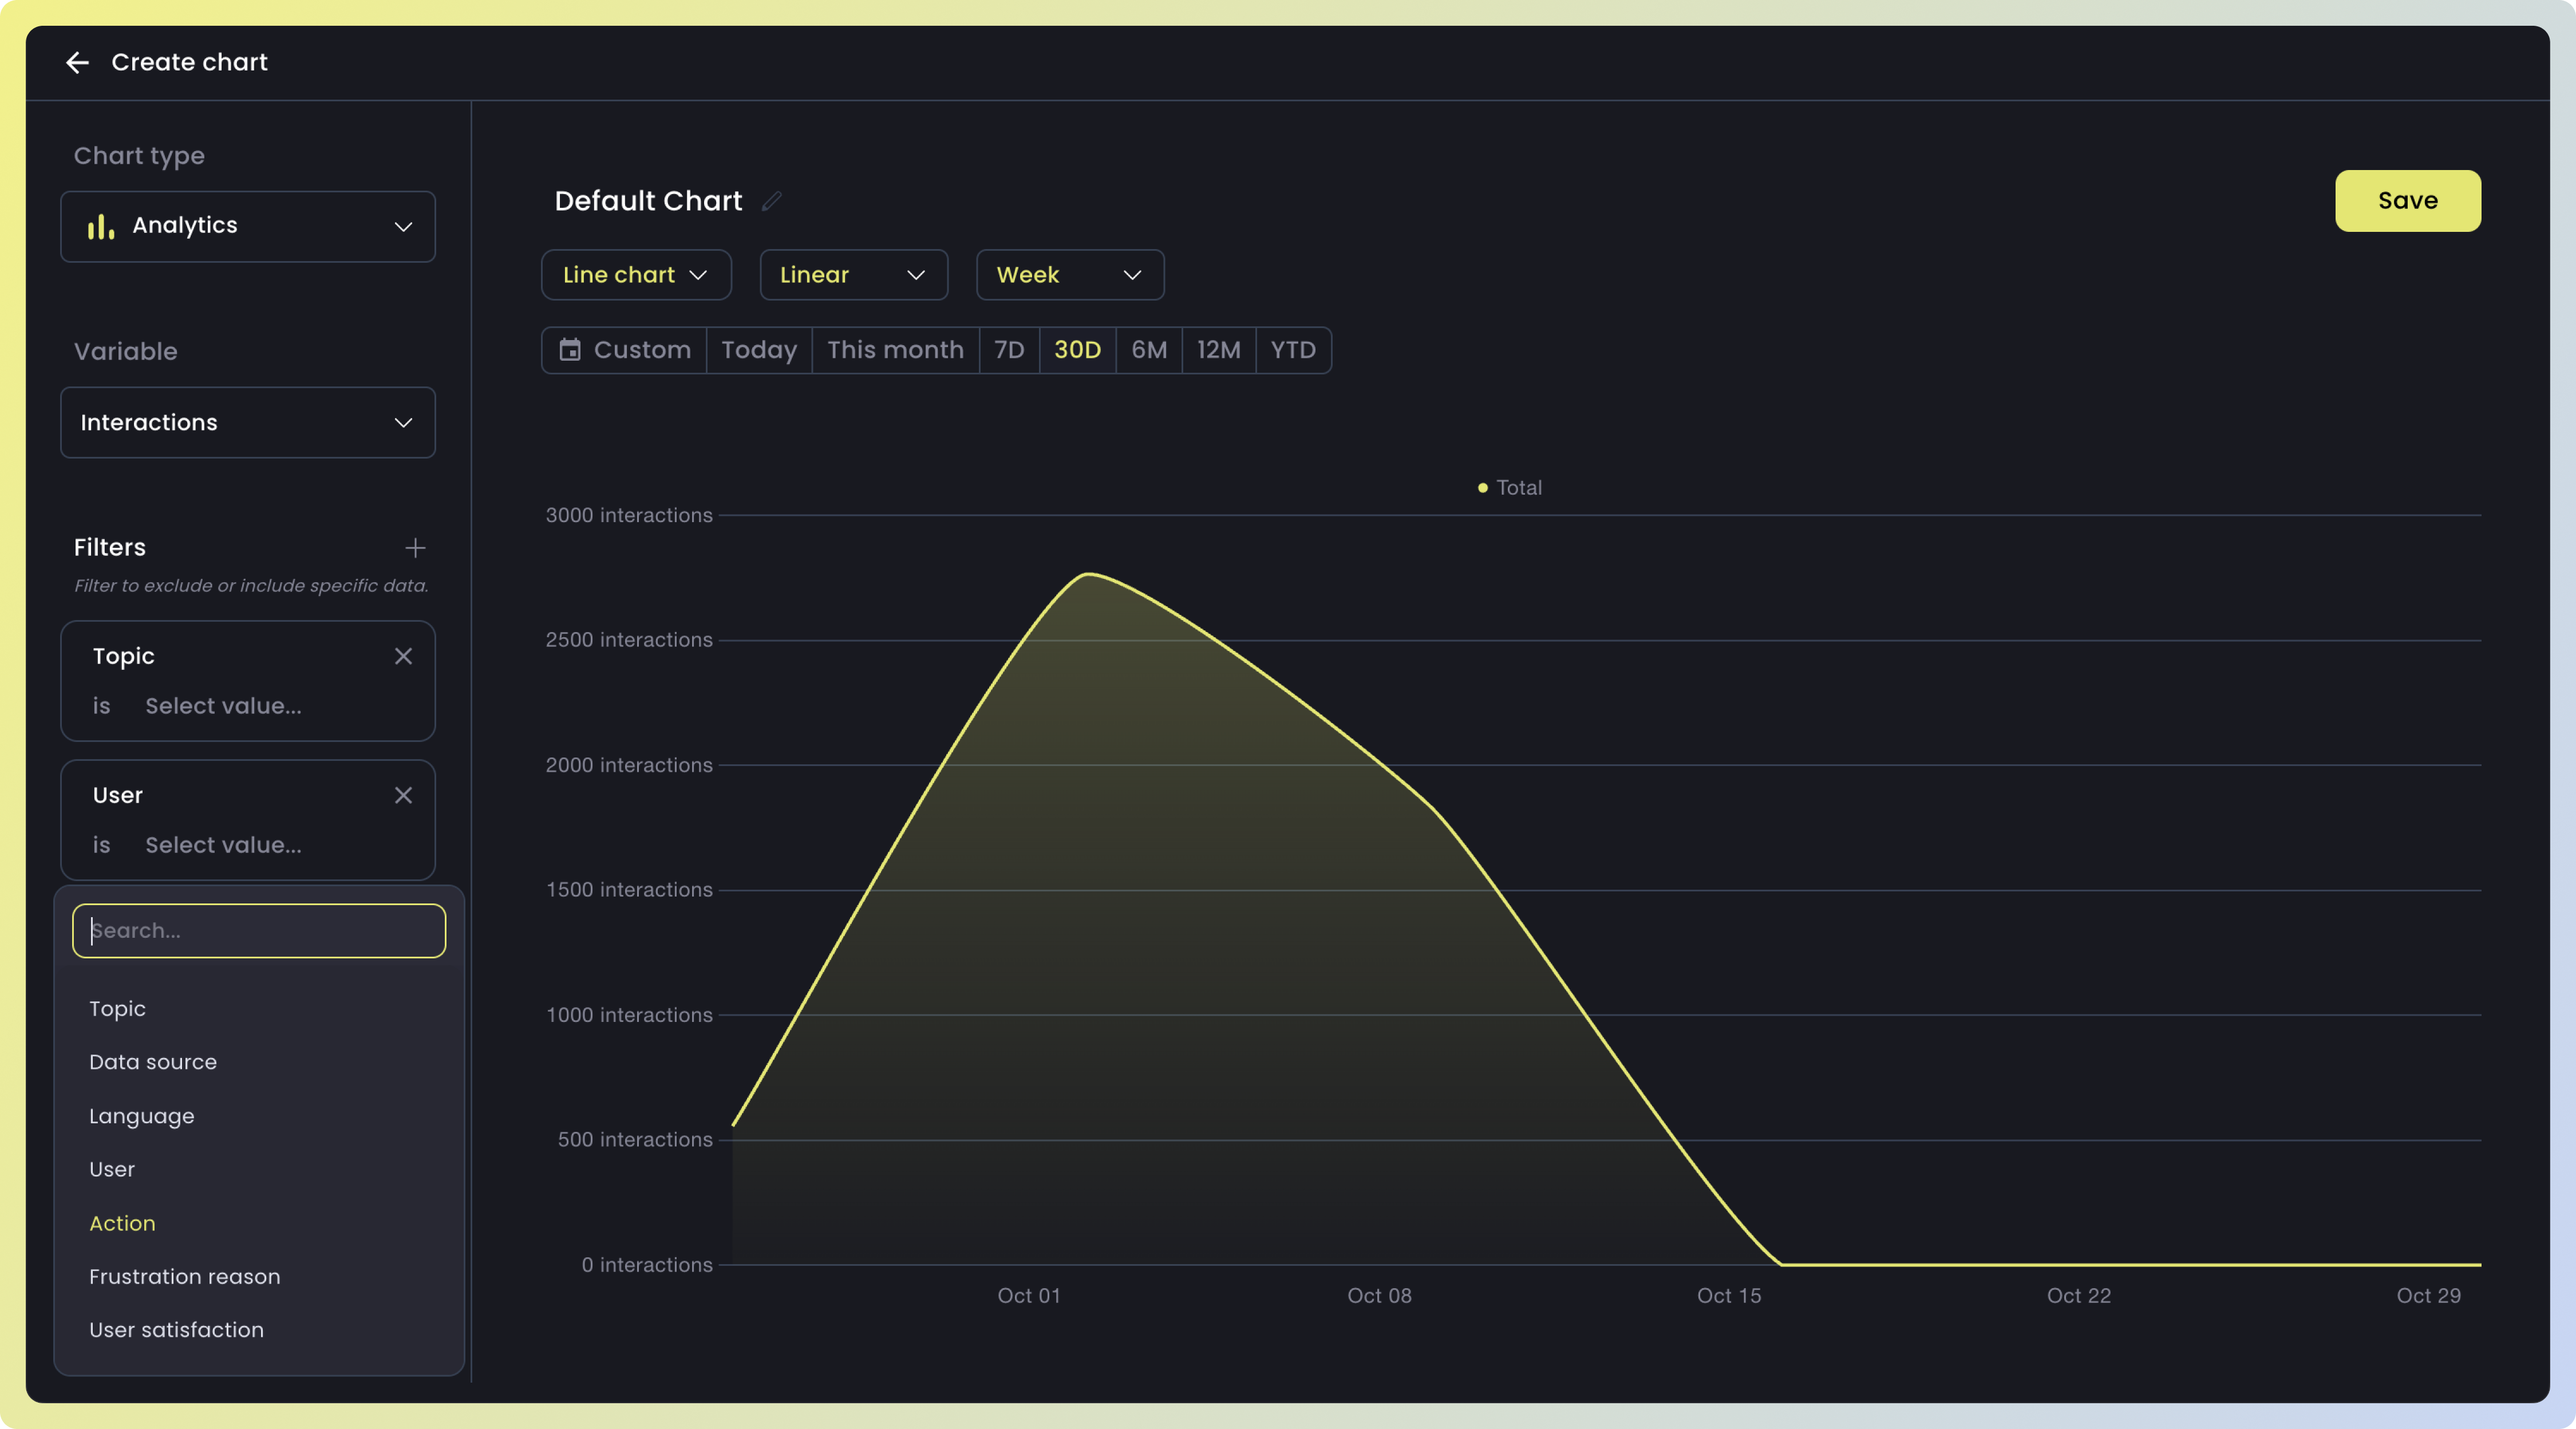
Step 2: Choose filters
Filter excludes unwanted data. You can choose one or more filters to narrow down your data. Supported filters are:
| Filter | Description |
|---|---|
| Topic | The main theme the user is talking about during the interaction |
| Data source | The external reference or knowledge sources the LLM might use to fetch or validate information |
| Language | The specific language (like English or Spanish) in which the model generates its response |
| User | The specific user ID |
| Action | The task (or question) the user performs during an interaction |
| Frustration reason | Specific reasons a user might be frustrated, such as the response being too wordy (verbosity), the model having insufficient knowledge, the model not understanding the query, the answer lacking clarity, or the answer not delving deep enough |
| User Satisfaction | A metric to assess user satisfaction with the Language Model (LLM) responses, where “useful” is defined as interactions without any detected reasons for frustration. A “Positive” rating is assigned if over 85% of the LLM interactions are useful. A “Neutral” rating applies when 65% to 85% of the conversations are free from detected frustration reasons. A “Negative” rating is given if less than 65% of the interactions are useful, meaning frustration reasons are detected in more than 35% of the interactions |
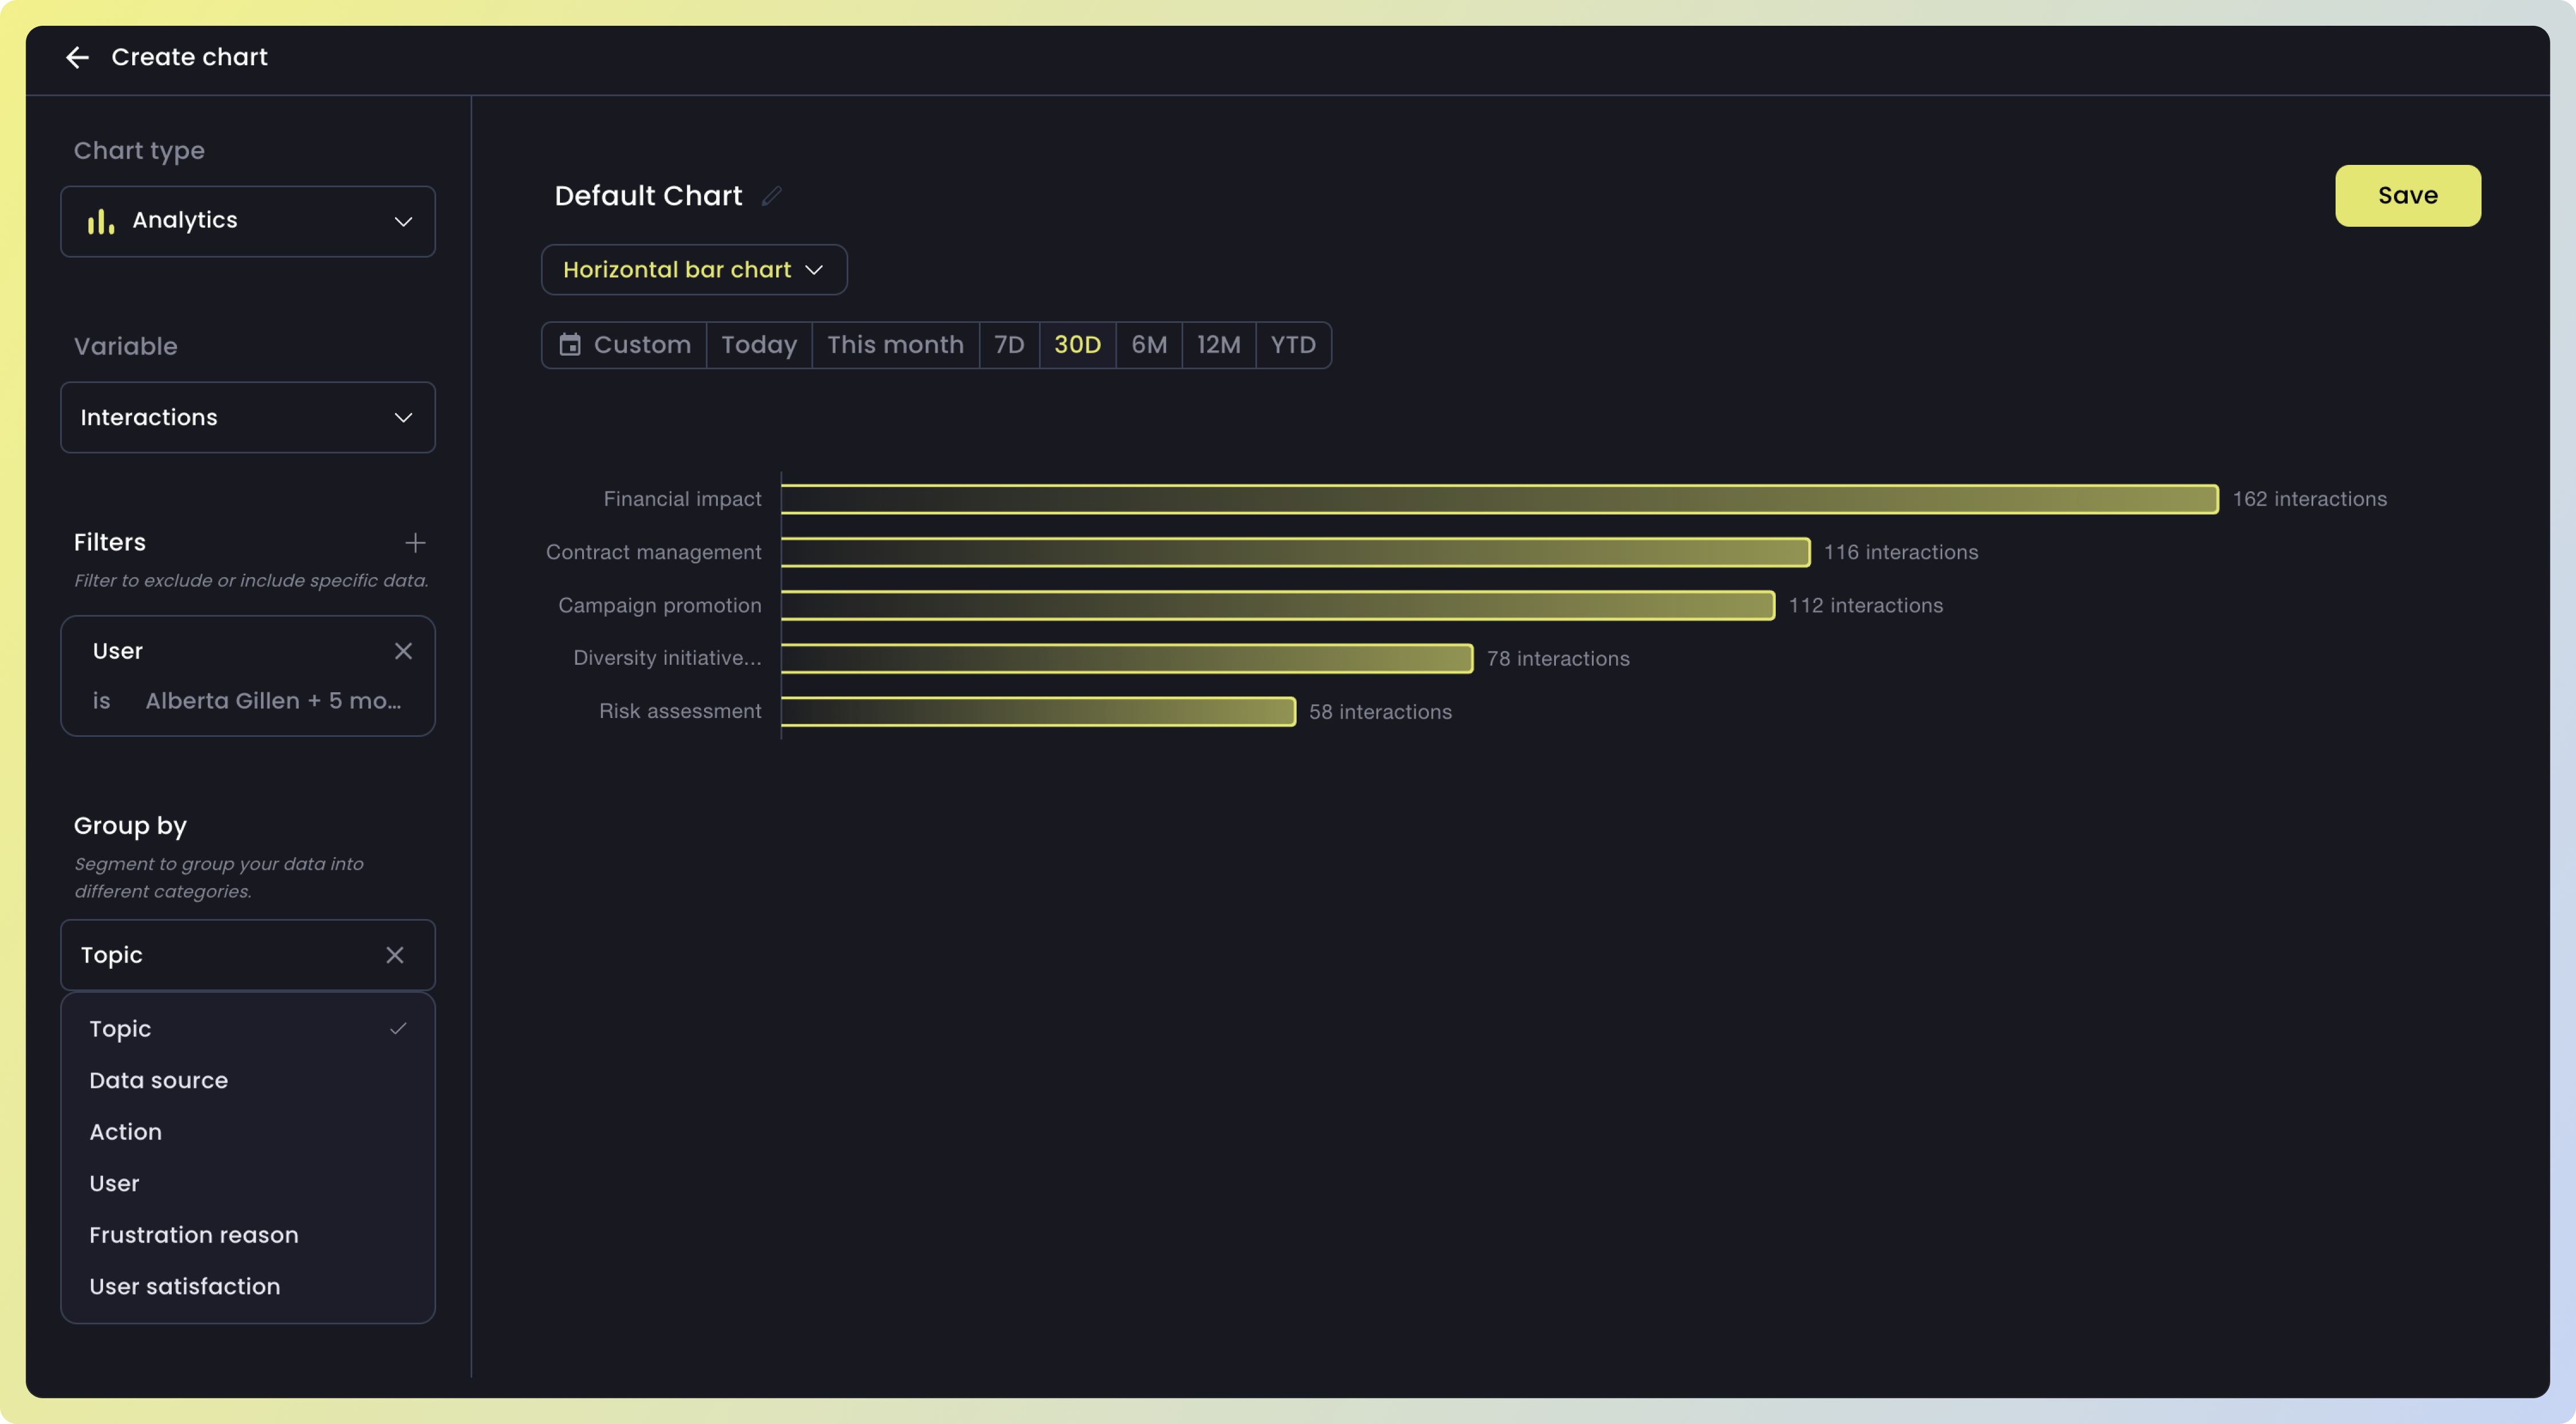
Step 3: Choose Group by
Group by segment data into groups. Supported breakdowns are:
| Group | Description |
|---|---|
| Topic | The main theme the user is talking about during the interaction |
| Data source | The external reference or knowledge sources the LLM might use to fetch or validate information |
| Language | The specific language (like English or Spanish) in which the model generates its response |
| User | The specific user ID |
| Action | The task (or question) the user performs during an interaction |
| Frustration reason | Specific reasons a user might be frustrated, such as the response being too wordy (verbosity), the model having insufficient knowledge, the model not understanding the query, the answer lacking clarity, or the answer not delving deep enough |
| User Satisfaction | A metric to assess user satisfaction with the Language Model (LLM) responses, where “useful” is defined as interactions without any detected reasons for frustration. A “Positive” rating is assigned if over 85% of the LLM interactions are useful. A “Neutral” rating applies when 65% to 85% of the conversations are free from detected frustration reasons. A “Negative” rating is given if less than 65% of the interactions are useful, meaning frustration reasons are detected in more than 35% of the interactions |
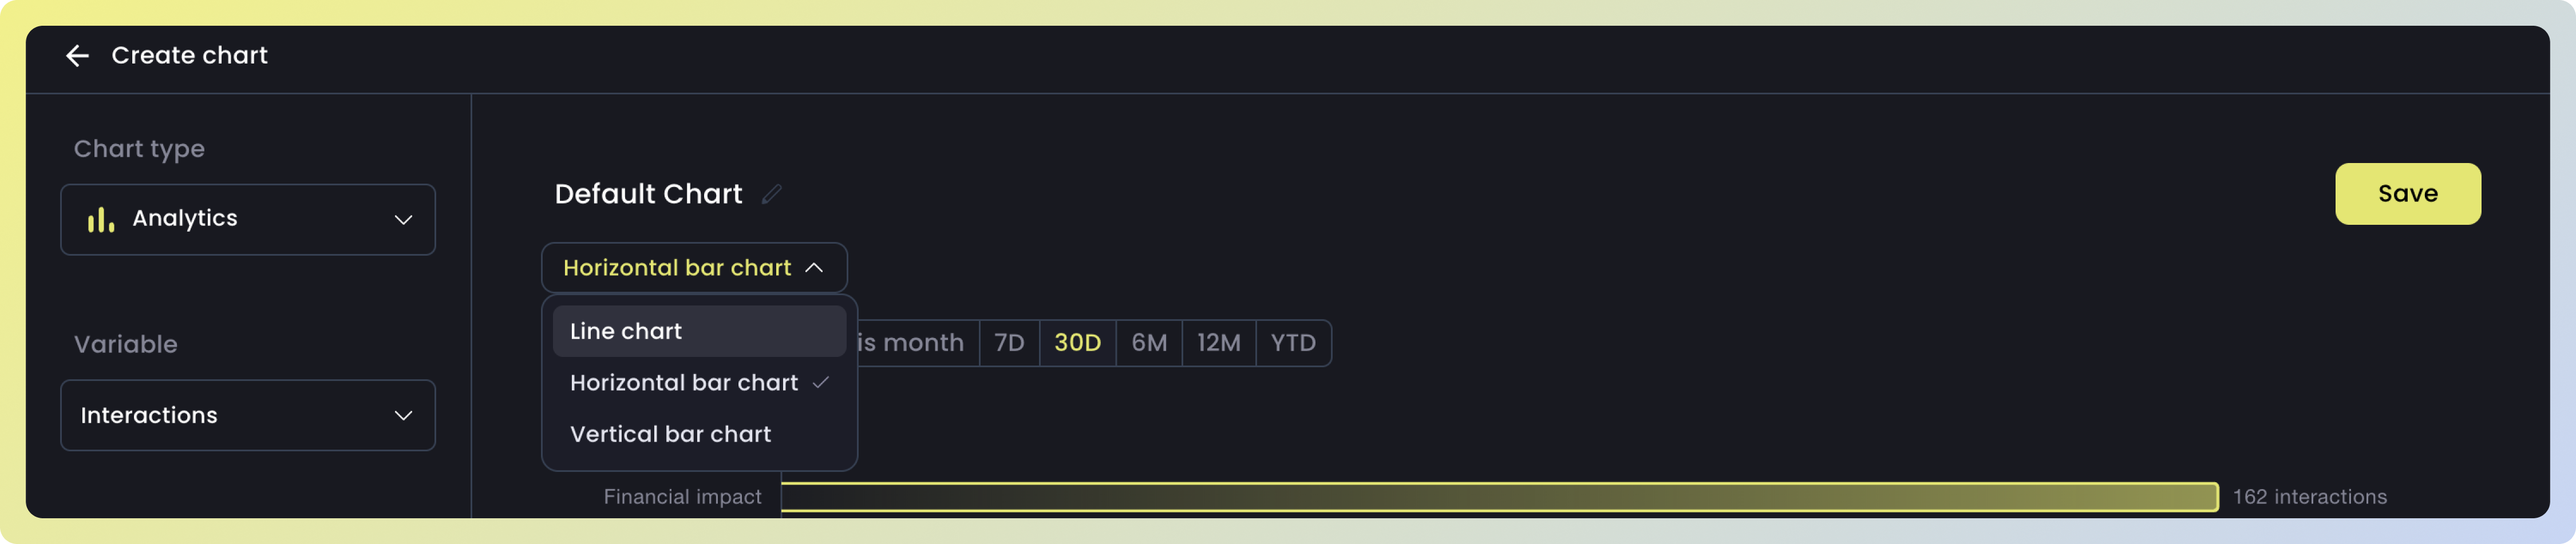
Step 4: Change visualization
Selecting an alternative chart type can enhance your data visualization. WhileLine chart is effective for identifying trends, other chart forms (e.g. Horizontal bar chart) can be more useful for viewing aggregated values.