User Flow chart is the best way to easily understand what your users are doing with your LLMs. This chart identifies the most frequent Actions (tasks or questions) done by your users. You can use User Flow to understand how your users sequentially ask questions to your LLM-product and analyze drop-offs or unsuccessful behavior.
Here are examples of the types of questions you can address using Flows:
- What did users do after asking an information?
- Which actions do users most frequently take after requesting a text rewrite?
- What actions lead up to a succesfull answer from the LLM?
Quick start
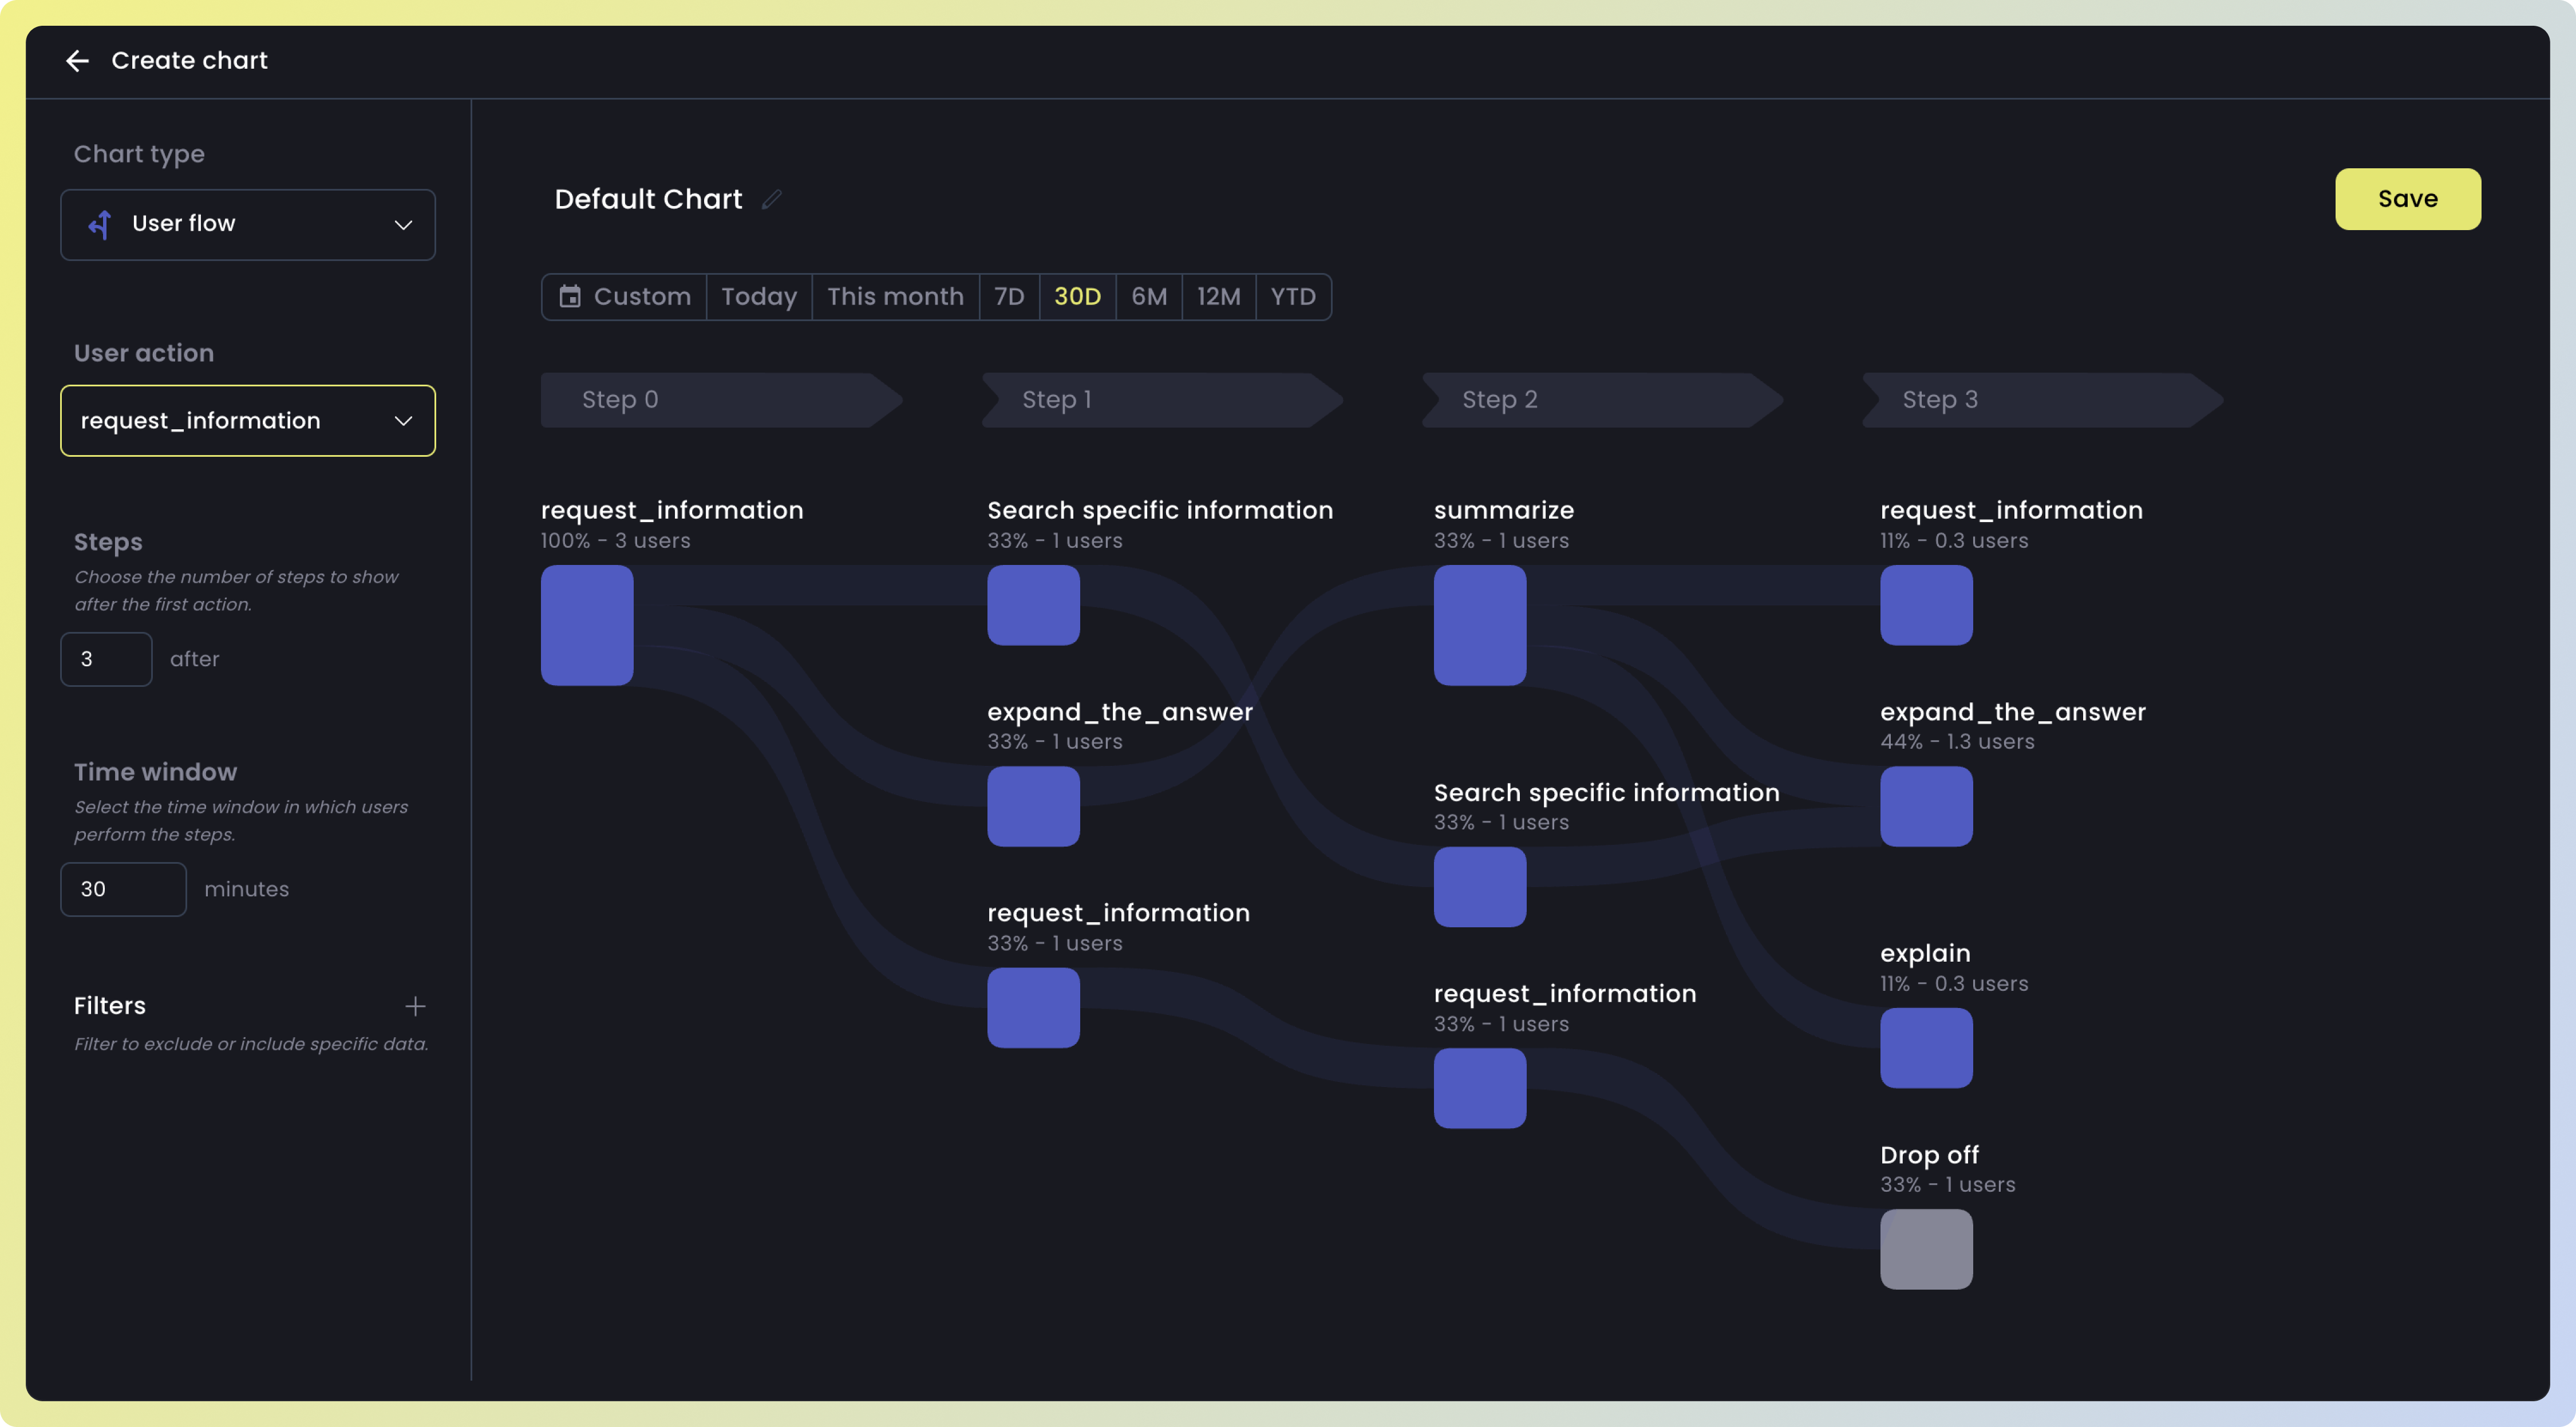
Creating aUser Flow chart involves the same fundamental steps as constructing any other type of chart. Generating a User flow chart is a quick and straightforward process, requiring only a few clicks, with results delivered almost instantaneously.
Step 1: Choose first action
Action forms the foundational element of a User Flow. To analyze user behavior, start by choosing the initial action. This means selecting the specific action after which you want to examine what actions users took subsequently.
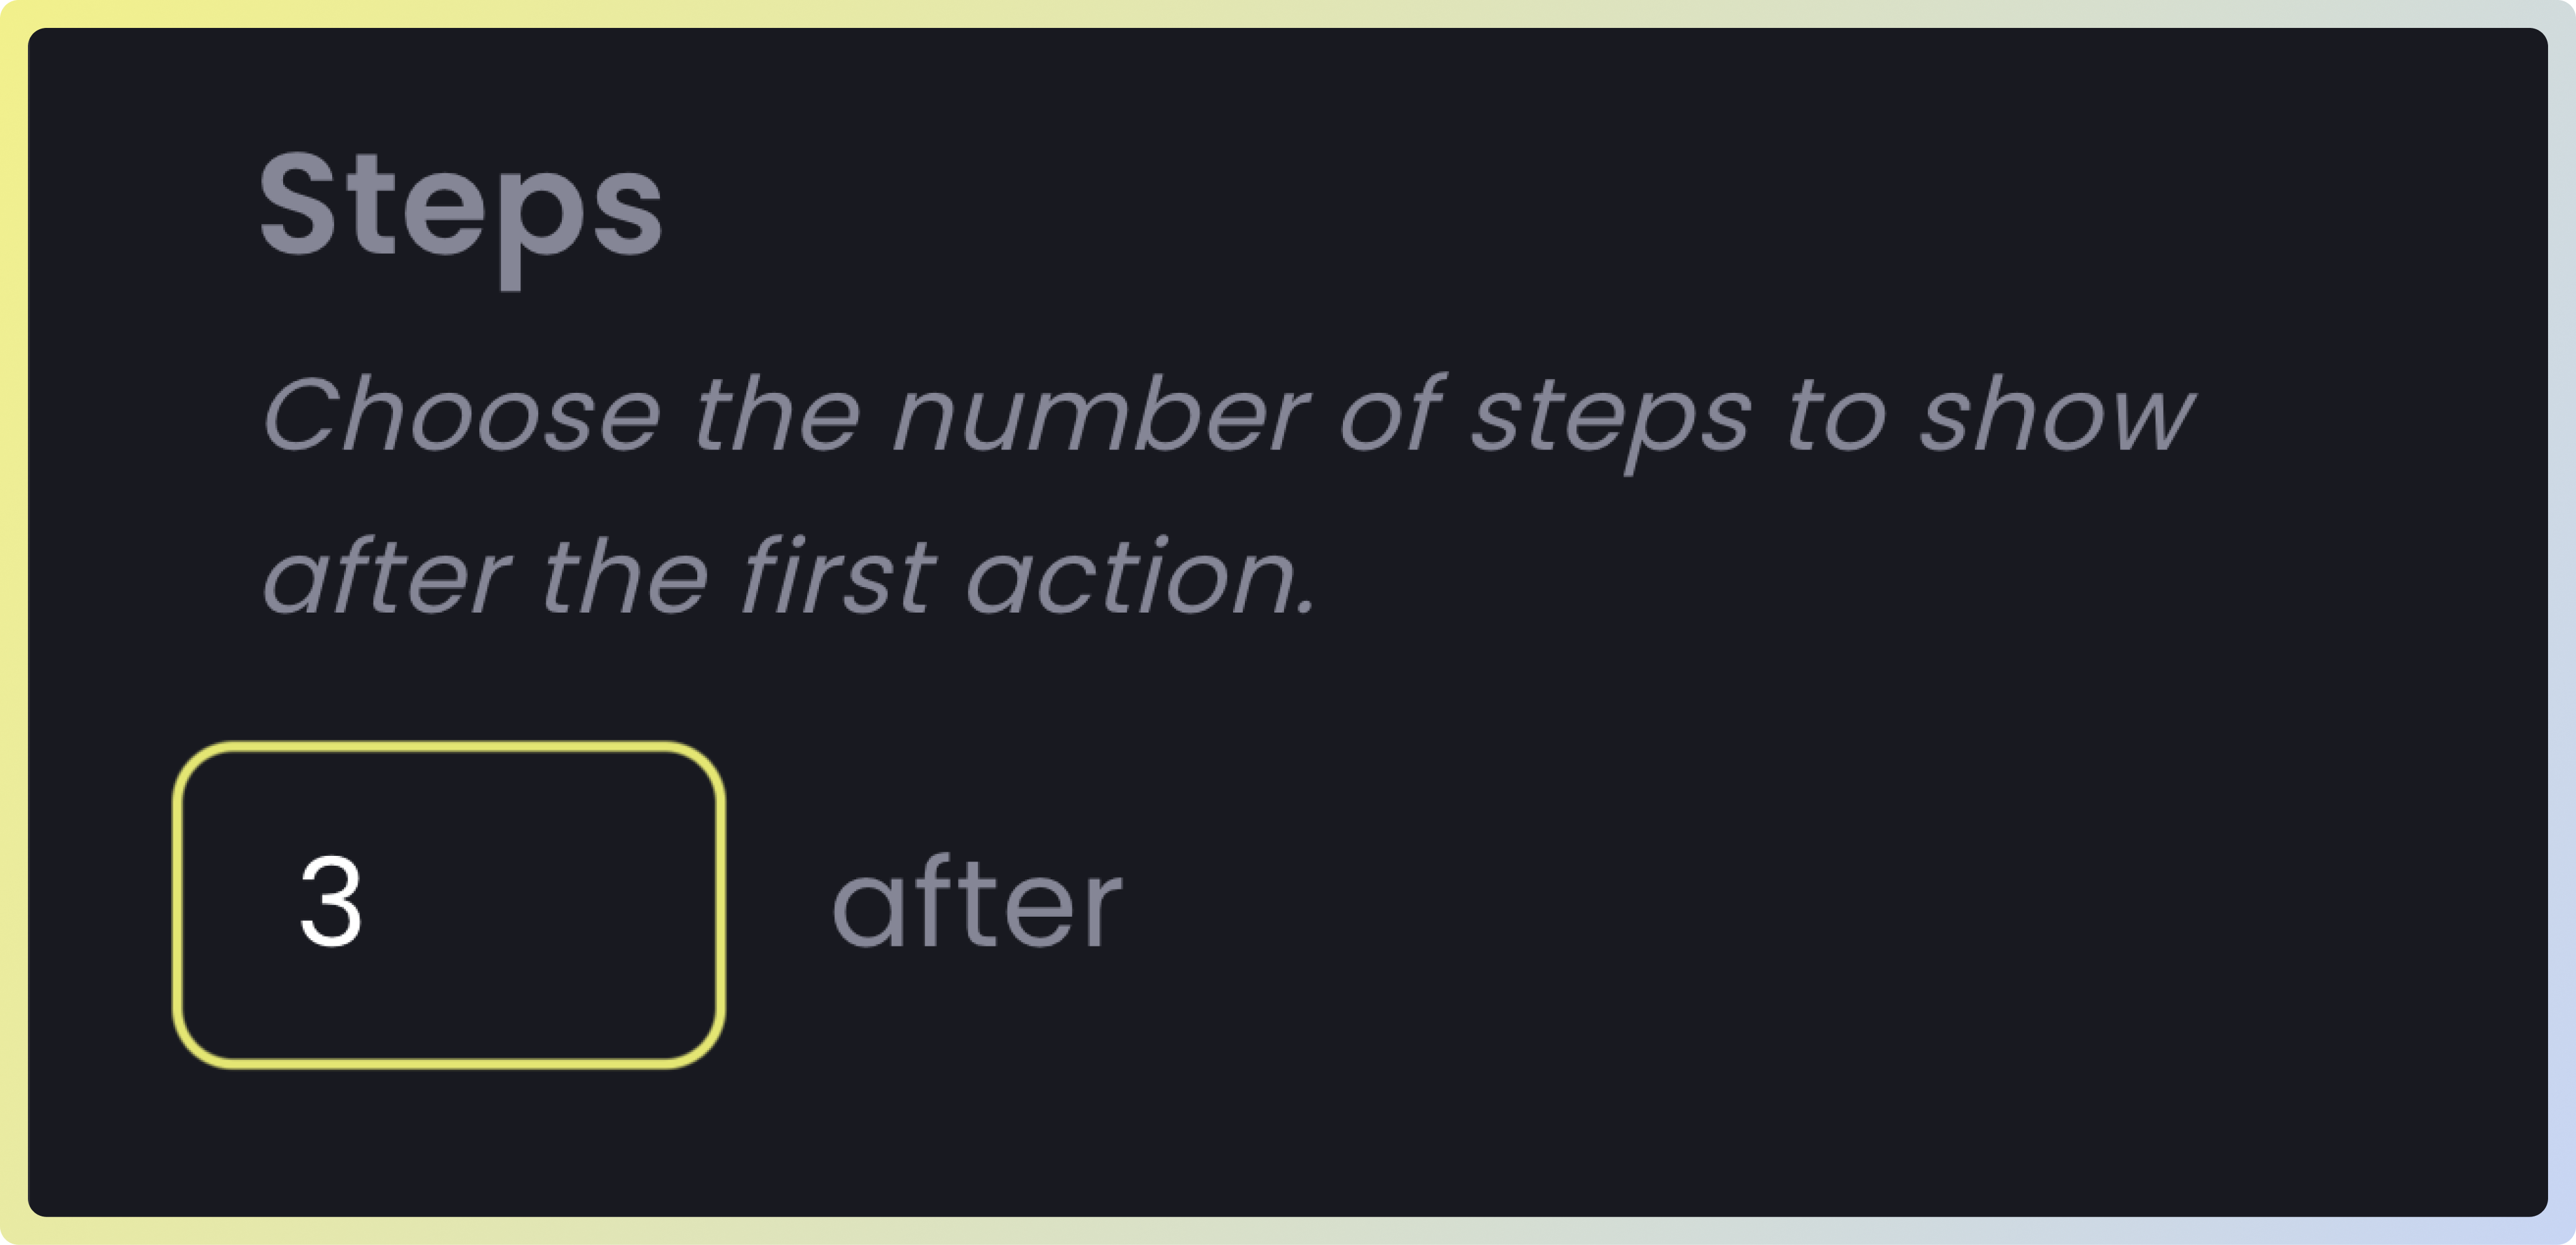
Step 2: Choose Steps Before/After Action
Choose a designated number ofSteps to identify the actions users took either before or after a particular action.
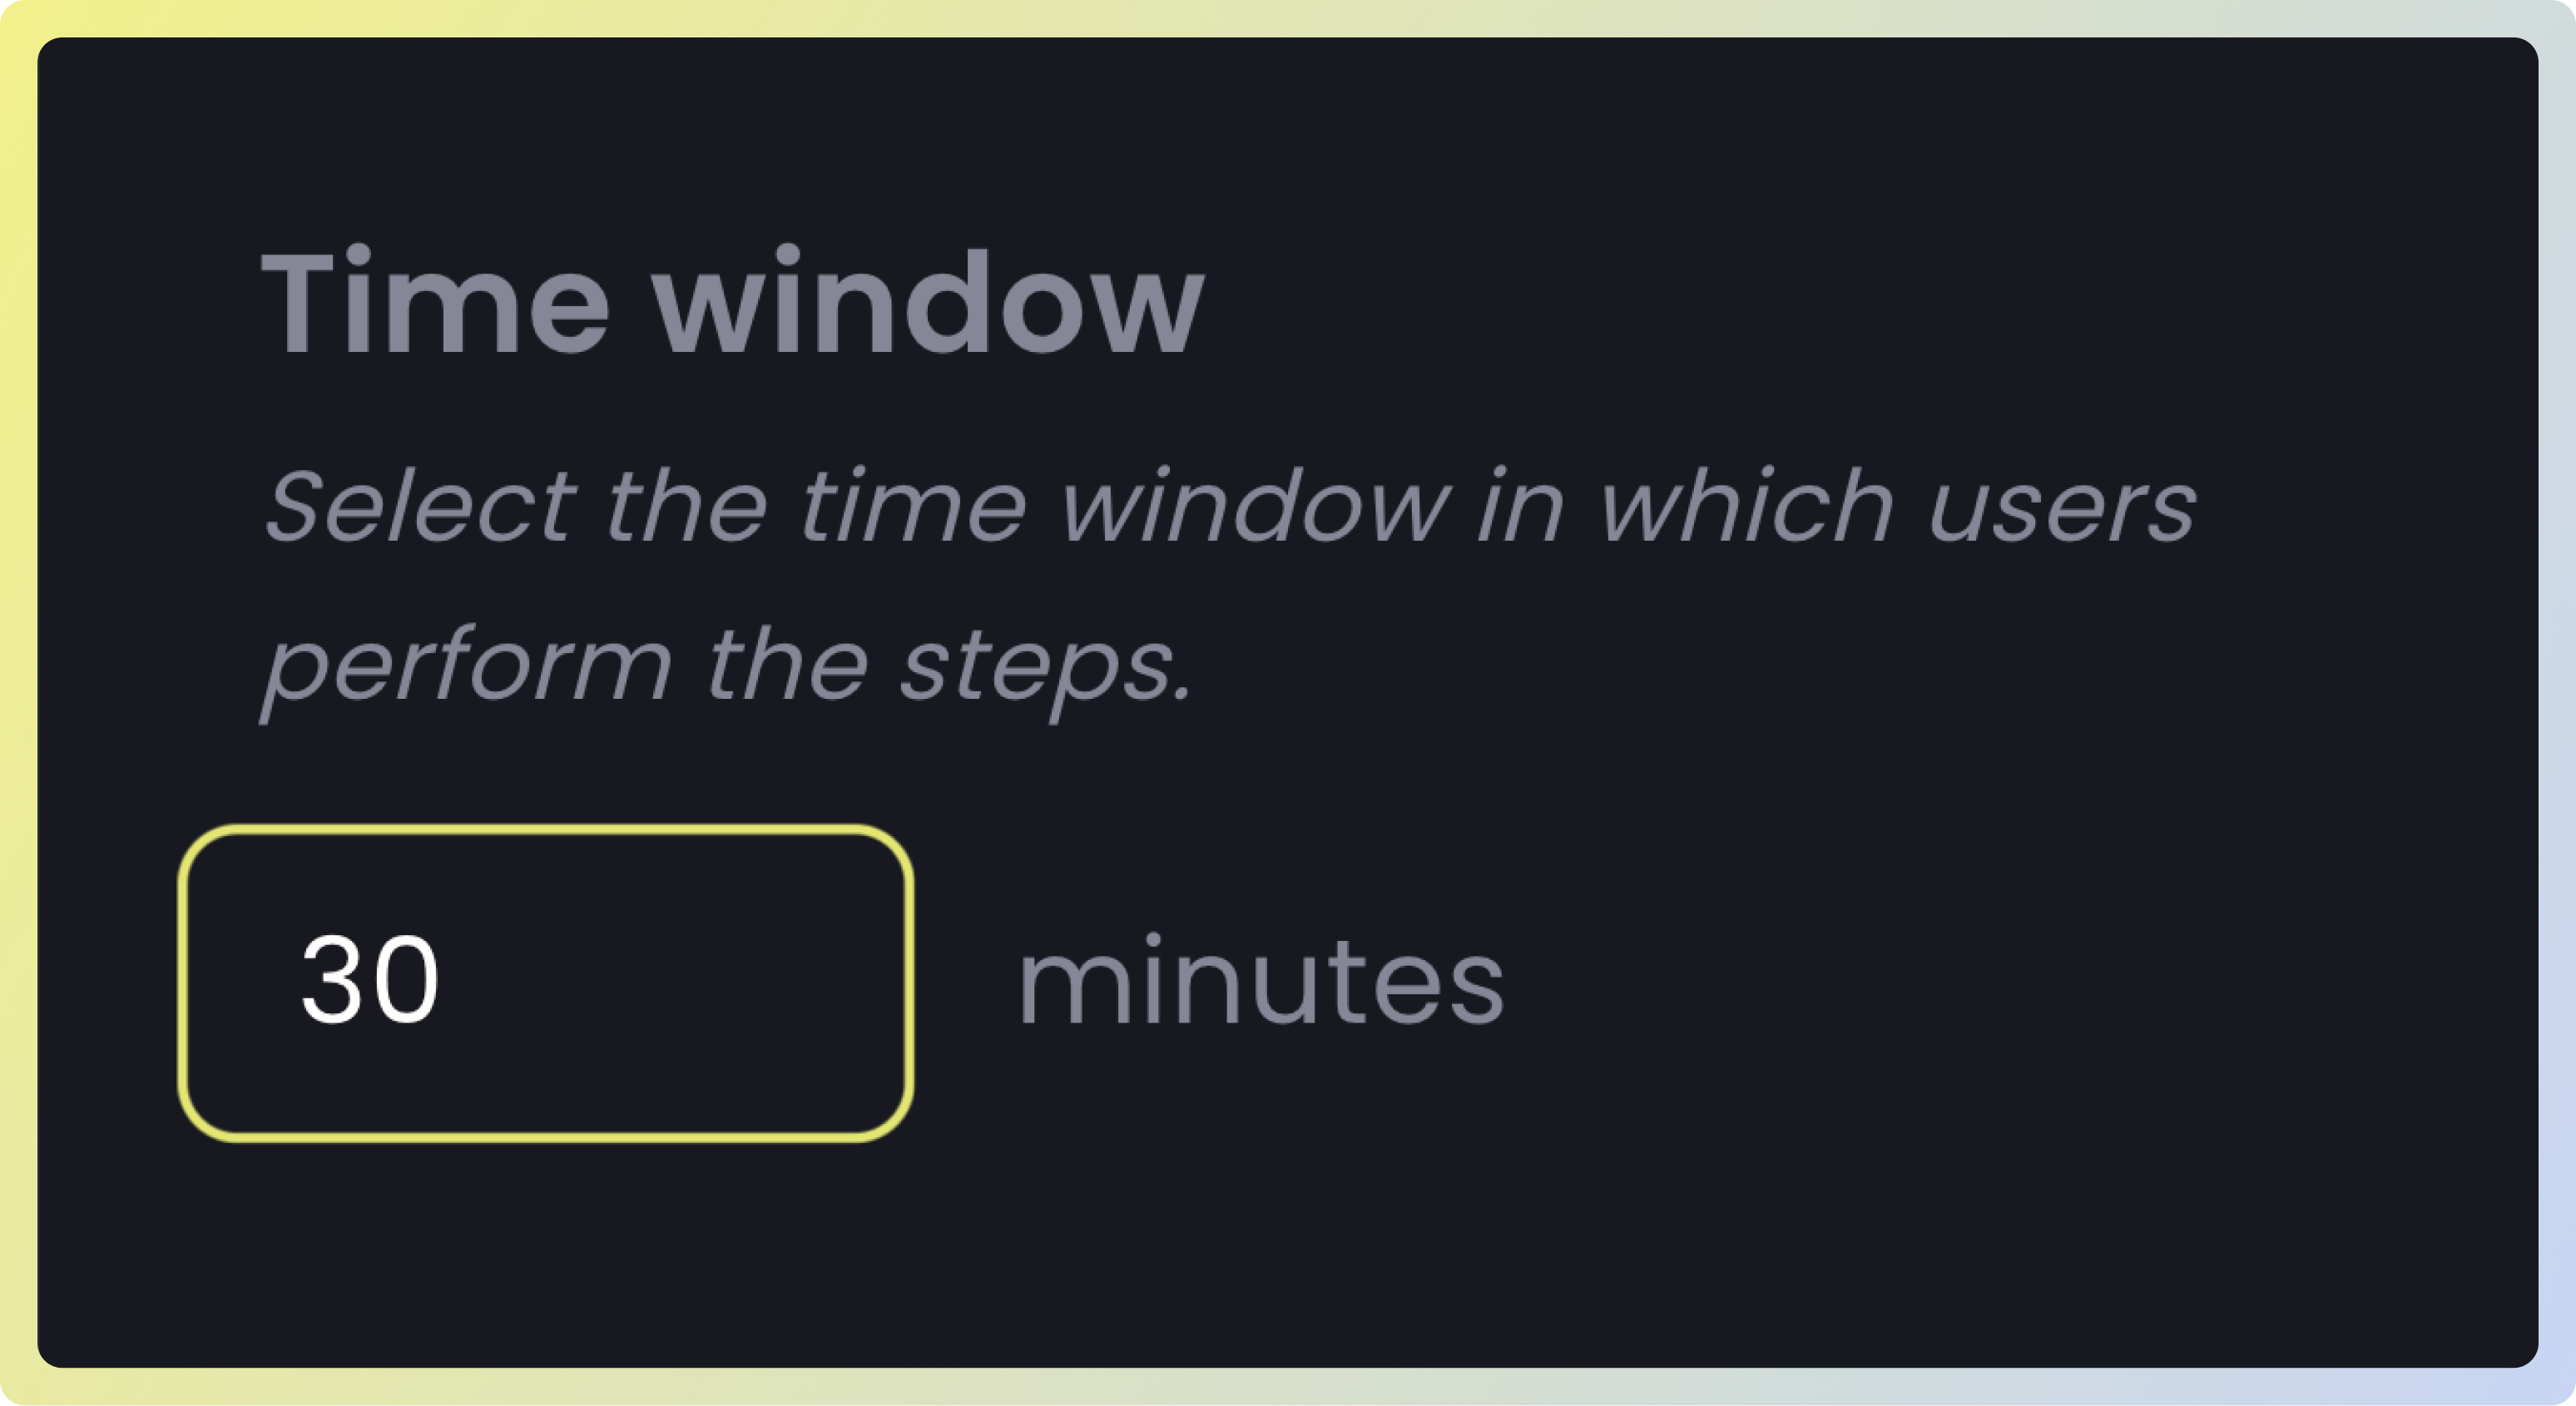
Step 3: Choose Time window
TheTime window is a set duration, for example, 30 minutes, during which you monitor the user’s actions. It highlights what users did within that period after initiating a specific event, like asking for a summary.
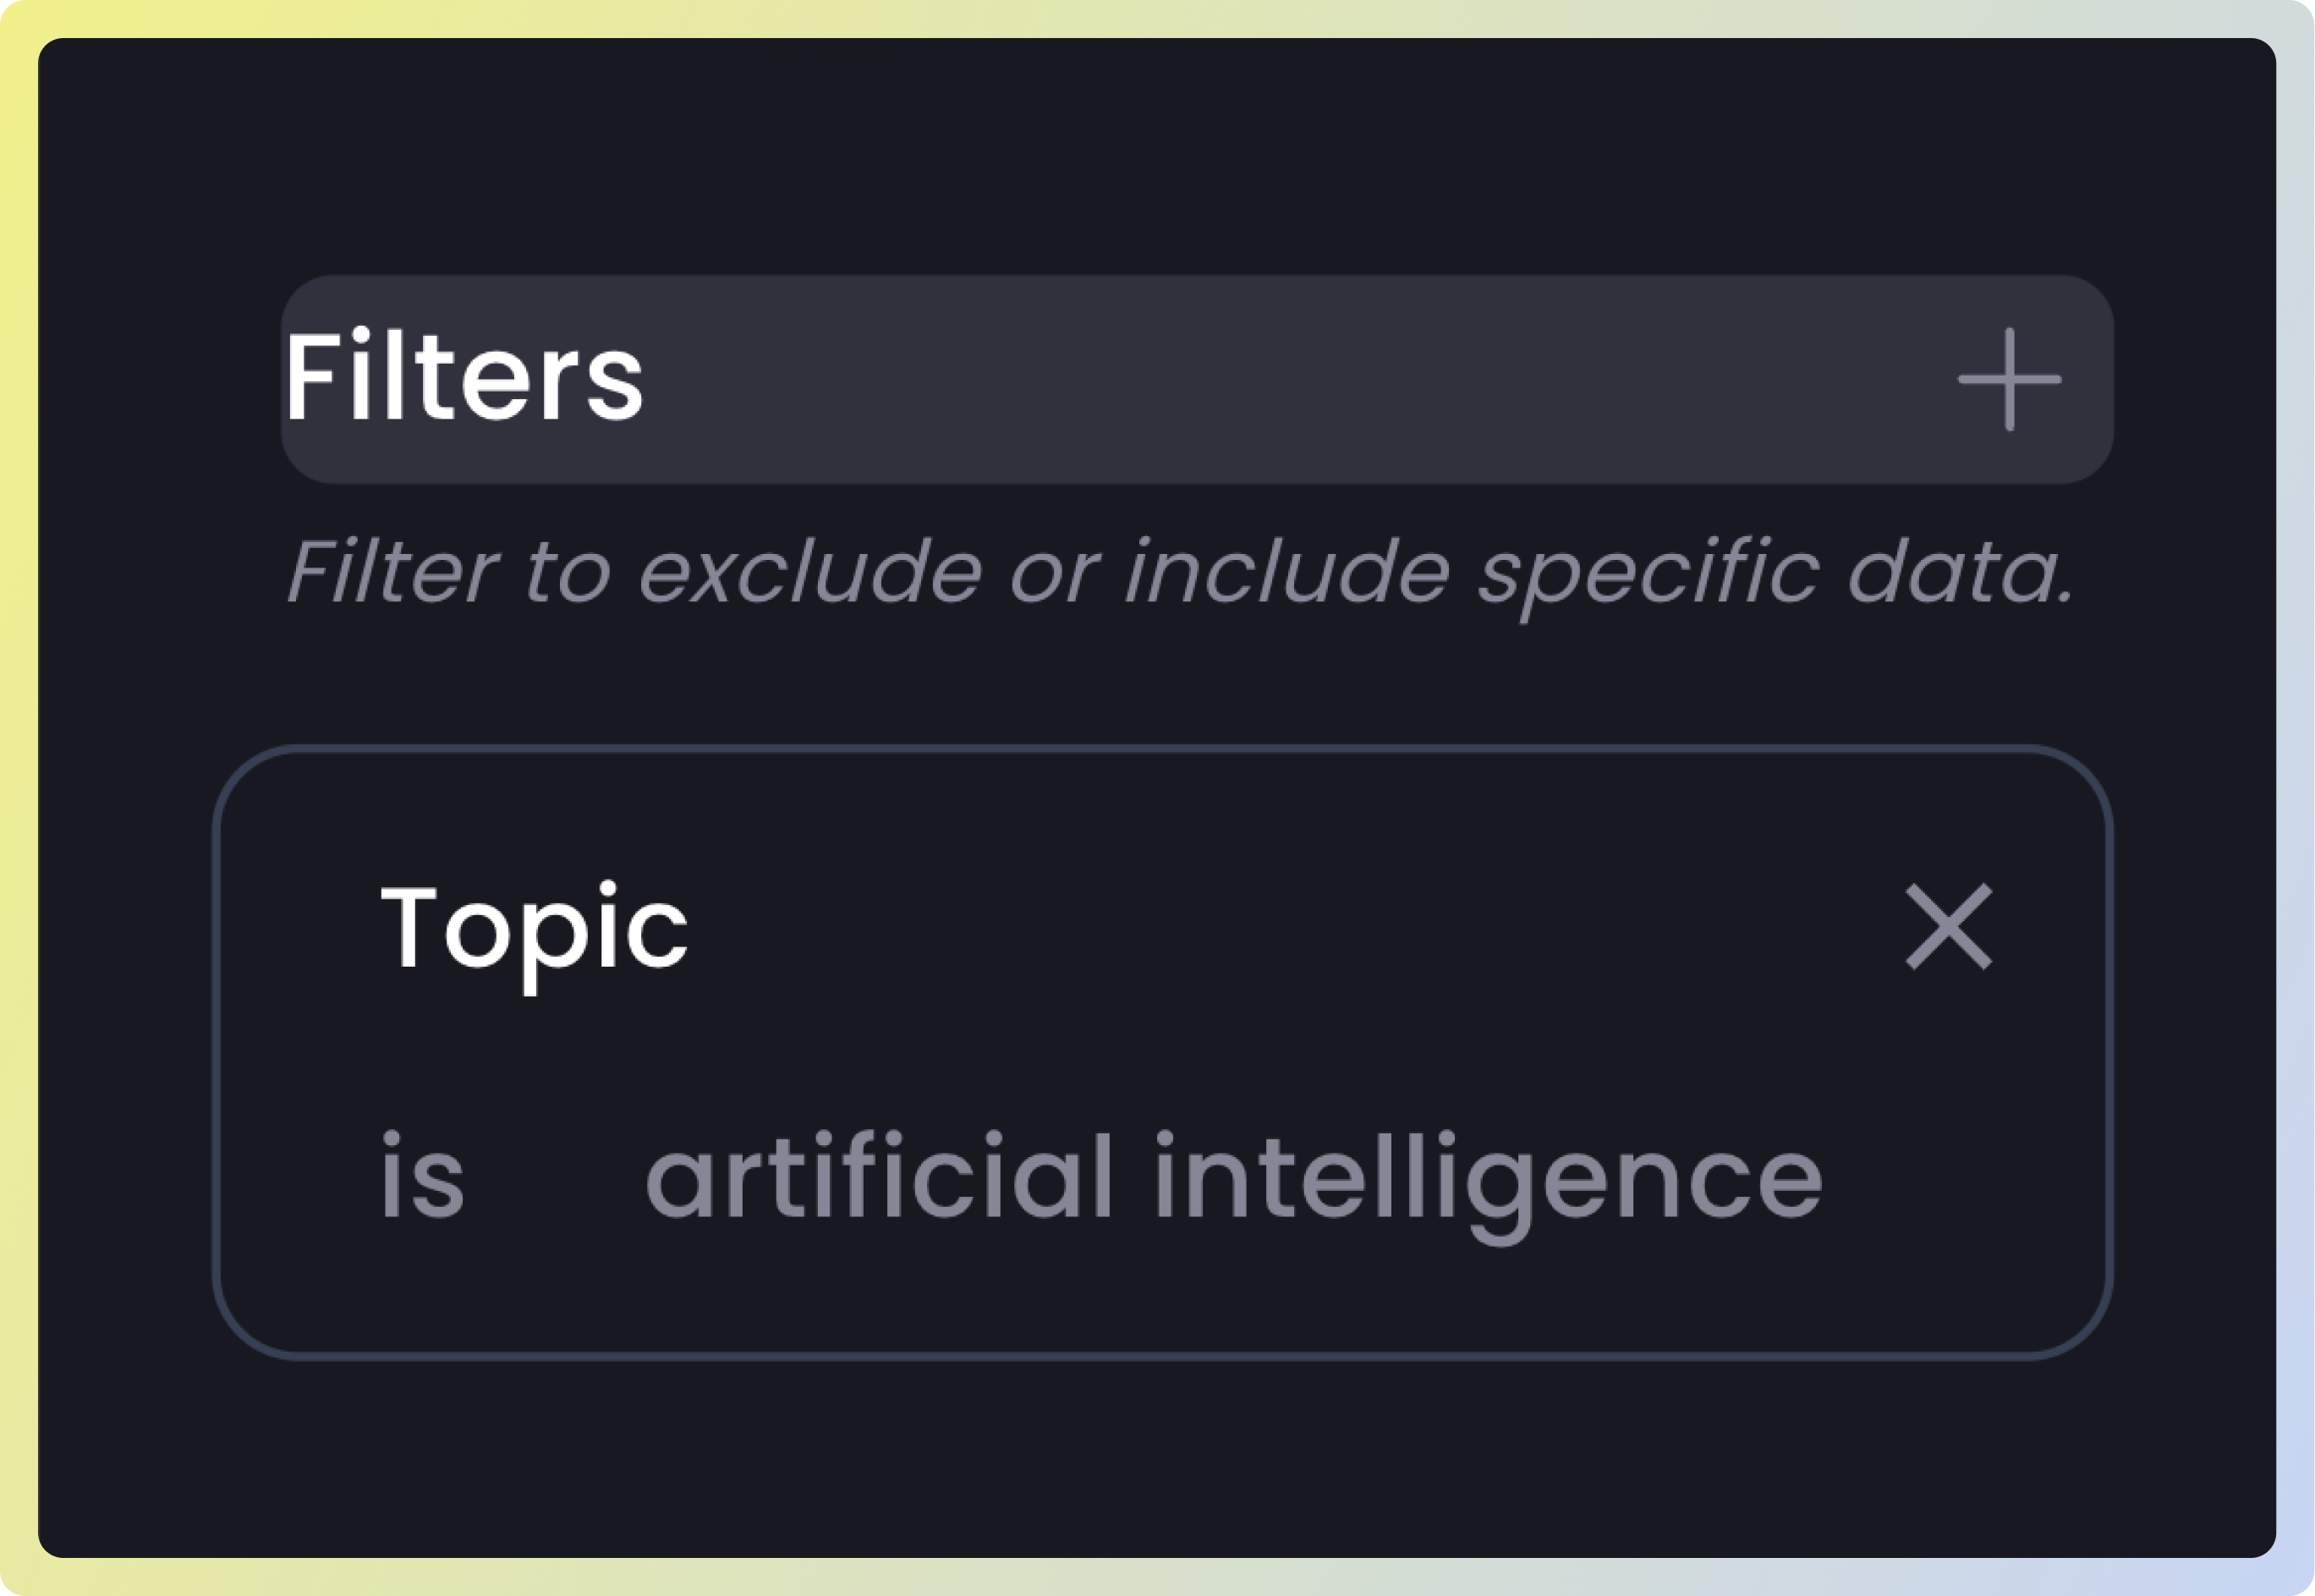
Step 4: Choose Filters
TheFilter applies to the initial user action you’ve chosen, enabling you to remove or exclude any undesired data from the results. Supported filters are:
| Filter | Description |
|---|---|
| Topic | The main theme the user is talking about during the interaction |
| Data source | The external reference or knowledge sources the LLM might use to fetch or validate information |
| Language | The specific language (like English or Spanish) in which the model generates its response |
| User | The specific user ID |
| Action | The task (or question) the user performs during an interaction |
| Frustration reason | Specific reasons a user might be frustrated, such as the response being too wordy (verbosity), the model having insufficient knowledge, the model not understanding the query, the answer lacking clarity, or the answer not delving deep enough |
| User Satisfaction | A metric to assess user satisfaction with the Language Model (LLM) responses, where “useful” is defined as interactions without any detected reasons for frustration. A “Positive” rating is assigned if over 85% of the LLM interactions are useful. A “Neutral” rating applies when 65% to 85% of the conversations are free from detected frustration reasons. A “Negative” rating is given if less than 65% of the interactions are useful, meaning frustration reasons are detected in more than 35% of the interactions |