

How the AI Proficiency score works
Each interaction is evaluated across six prompting behaviors. The behavior scores are weighted and combined into an AI Proficiency score from 0 to 100. A higher score indicates that users communicate their goals more clearly, provide the information AI needs, and reach useful results more efficiently. The AI Proficiency score is calculated over a rolling 30-day window. Nebuly uses all anonymized interactions from the most recent 30 days to calculate the score for your organization, team, or other selected group. Using a rolling window keeps the score focused on current behavior. As new interactions are added and older ones fall outside the 30-day window, the score updates to reflect the latest snapshot of your organization’s AI proficiency. The AI Proficiency formula:
Each behavior contributes to the final score according to its weight. Behaviors with a higher weight have a larger effect on the overall AI Proficiency score.
Click How it’s calculated to see the individual behavior scores, their weights, and how many points each behavior contributes to the final score.
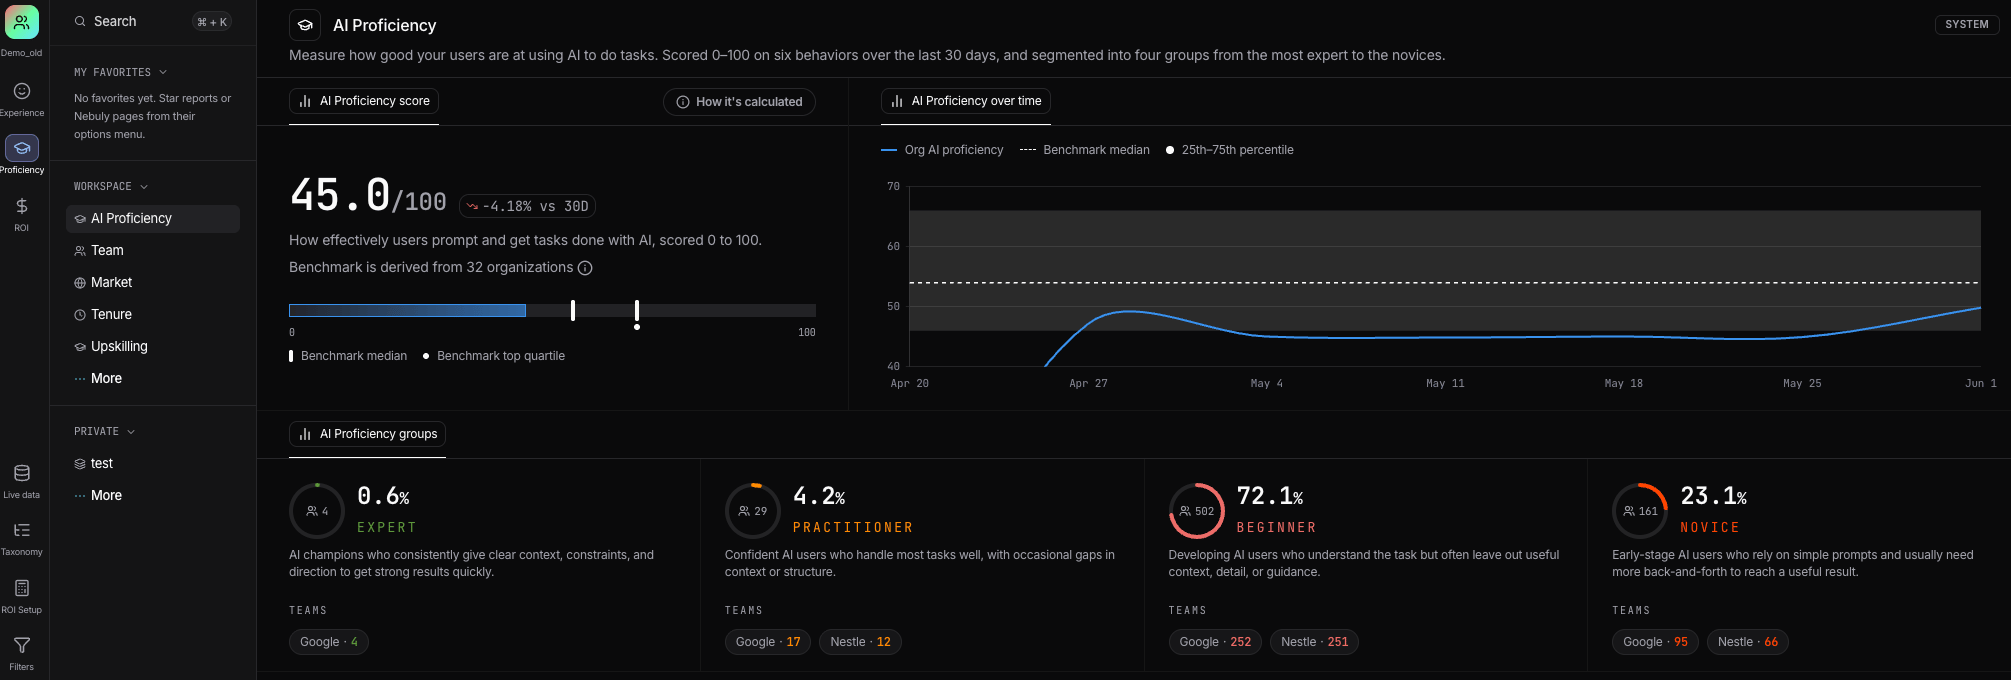
AI Proficiency score
The AI Proficiency score gives you an overall view of how effectively users in your organization work with AI. The report shows the current score and how it has changed compared with the previous period. You can also compare your organization’s score with the Nebuly benchmark:- Benchmark median shows the midpoint of the benchmark population.
- Benchmark top quartile shows the level reached by the top-performing quarter of the benchmark population.
How the benchmark is built
The Nebuly benchmark combines anonymized proficiency data from Nebuly customers who agree to contribute their data with findings from broader industry and academic research on AI proficiency and fluency. Using both sources gives you a broader reference point for understanding how your organization’s AI proficiency compares with other organizations and with patterns observed across the wider workforce. Benchmarks may evolve over time as Nebuly incorporates more participating organizations and new research.AI Proficiency over time
The AI Proficiency over time chart shows how your organization’s score changes throughout the selected period. It includes:- Your organization’s AI Proficiency score
- The benchmark median
- The 25th to 75th percentile range of the benchmark
AI Proficiency groups
Users are automatically assigned to one of four AI Proficiency groups based on their proficiency:| Group | What it means |
|---|---|
| Expert | Consistently provides clear context, constraints, and direction to reach strong results quickly |
| Practitioner | Handles most AI tasks well, with occasional gaps in context or structure |
| Beginner | Understands the task but often leaves out useful context, detail, or guidance |
| Novice | Relies on simpler prompts and typically needs more back-and-forth to reach a useful result |
- The share of users in the group
- The number of users in the group
- How those users are distributed across teams
AI Proficiency groups progress over time
The AI Proficiency groups progress over time section shows how users move between proficiency groups. Group movement is calculated over a rolling 30-day window. A user’s current proficiency group is compared with their group 30 days earlier to determine whether they moved up, slipped back, or stayed at the same level. Users are divided into three categories:- Moved up: users who progressed to a higher proficiency group
- Slipped back: users who moved to a lower proficiency group
- Stayed: users who remained in the same group
Build your own reports
AI Proficiency metrics and dimensions are also available in Nebuly’s reporting engine. You can combine AI Proficiency scores, proficiency groups, and individual prompting behaviors with your existing filters and groupings to analyze proficiency across teams, projects, business units, or other user segments. For example, you can use custom reports to understand:- How proficiency changes over time
- How proficiency differs across teams or business units
- Which prompting behaviors have the largest gaps
- Which groups are improving after training or enablement initiatives