

Why measure spend per task
Token usage explains how much model capacity was consumed, but it is difficult to use as a measure of business activity. A task groups the interactions required to complete a piece of work. Measuring spend at this level gives you a clearer view of what your organization is paying to accomplish.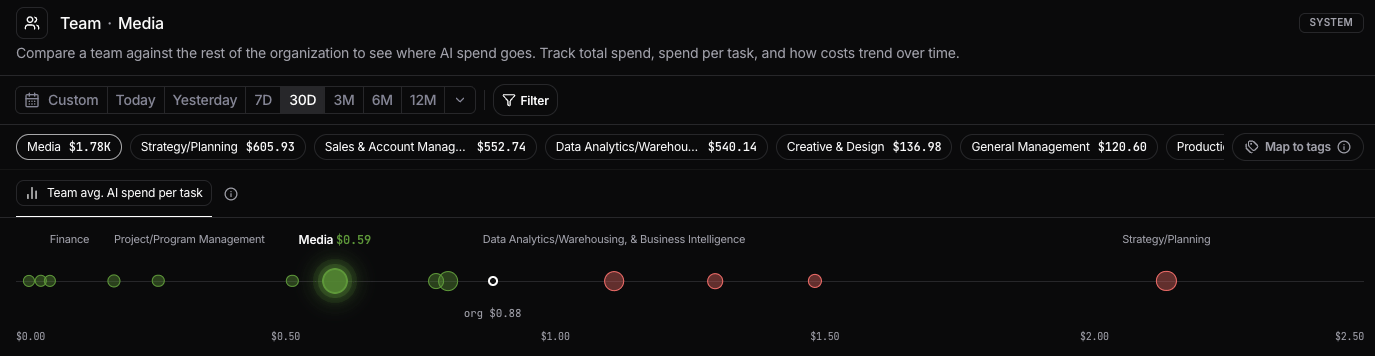
Total AI spend
Total AI spend shows how much your organization spent on AI during the selected period. Click Breakdown to see how that spend is distributed across groups such as Team, Market, or Tenure. This helps you identify which parts of the organization account for the largest share of AI spend.Average AI spend per task
Avg. AI spend per task shows the average cost of completing a task across the AI models and providers used by your organization. The distribution chart compares spend per task across teams and provides two reference points:- Organization average shows the average spend per task across the organization.
- Top quartile shows the spend per task reached by the most cost-efficient 25% of teams.
AI spend over time
The AI spend over time chart shows how costs change across the selected period. You can switch between two views:- Total AI spend shows the amount spent during each period.
- AI spend per task shows how the average cost of completing a task changes over time.
AI spend distribution
The AI spend distribution section shows how your spend is distributed across a selected dimension. Use the dropdown to group spend by Task, Model, Team, Market, or Tenure.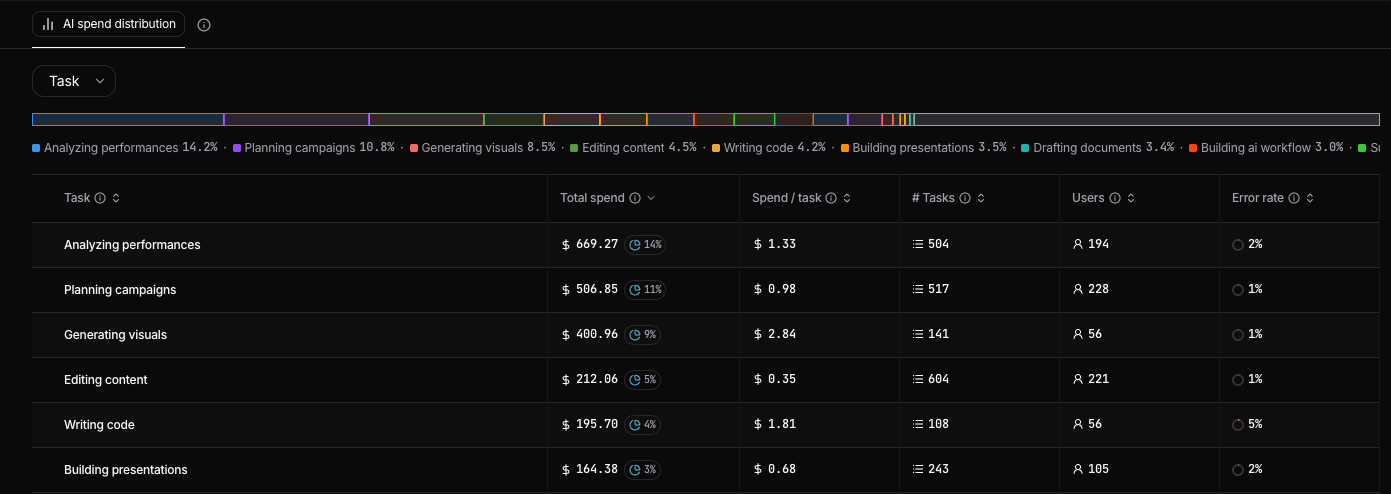
| Metric | What it shows |
|---|---|
| Total spend | Total AI cost for the item and its share of overall spend |
| Spend / task | Average AI cost of executing one task |
| # Tasks | Number of tasks completed |
| Users | Number of users associated with those tasks |
| Error rate | Share of tasks that resulted in an error |
Team view
Select Team from the left sidebar to view AI Spend grouped by team. From there, click a team to open its dedicated Team view. The team selector at the top lets you move between teams and compare their total spend. Use Map to tags to define which user tags correspond to each team, in case you’re not using the Team attribute. The Team avg. AI spend per task view places teams on the same spend-per-task scale. It shows the selected team’s position alongside the organization average, making it easier to compare task costs across teams. The rest of the page uses the same metrics as the organization-level view, including Total AI spend, Avg. AI spend per task, and AI spend over time, filtered to the selected team.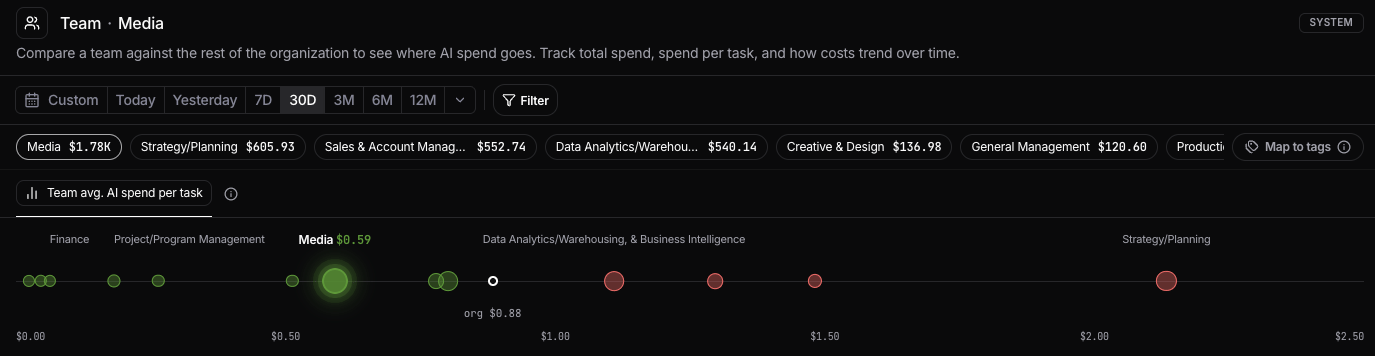
Build your own reports
AI Spend metrics are also available in Nebuly’s reporting engine. You can combine AI spend, spend per task, task volume, model, and user attributes with your existing filters and groupings to investigate specific cost patterns. For example, you can build reports to understand:- Which tasks account for the largest share of AI spend
- How spend per task differs across teams or models
- Which models are used for the most expensive tasks
- How AI costs change over time
- Where high spend per task coincides with high error rates