Built-in variables cover most needs, but when creating or editing an Analytics or Table chart you can also define custom variables. Custom variables support mathematical formulas, so you can express calculations that aren’t possible with built-in variables alone. Formulas can reference both built-in and custom variables, and filters can be applied as usual, letting your team track the metrics that matter most to how you measure the AI product.

Creating a new variable

To create a custom variable, open the chart builder for an Analytics or Table chart. In the Metrics panel on the left, click + Create New Metric.
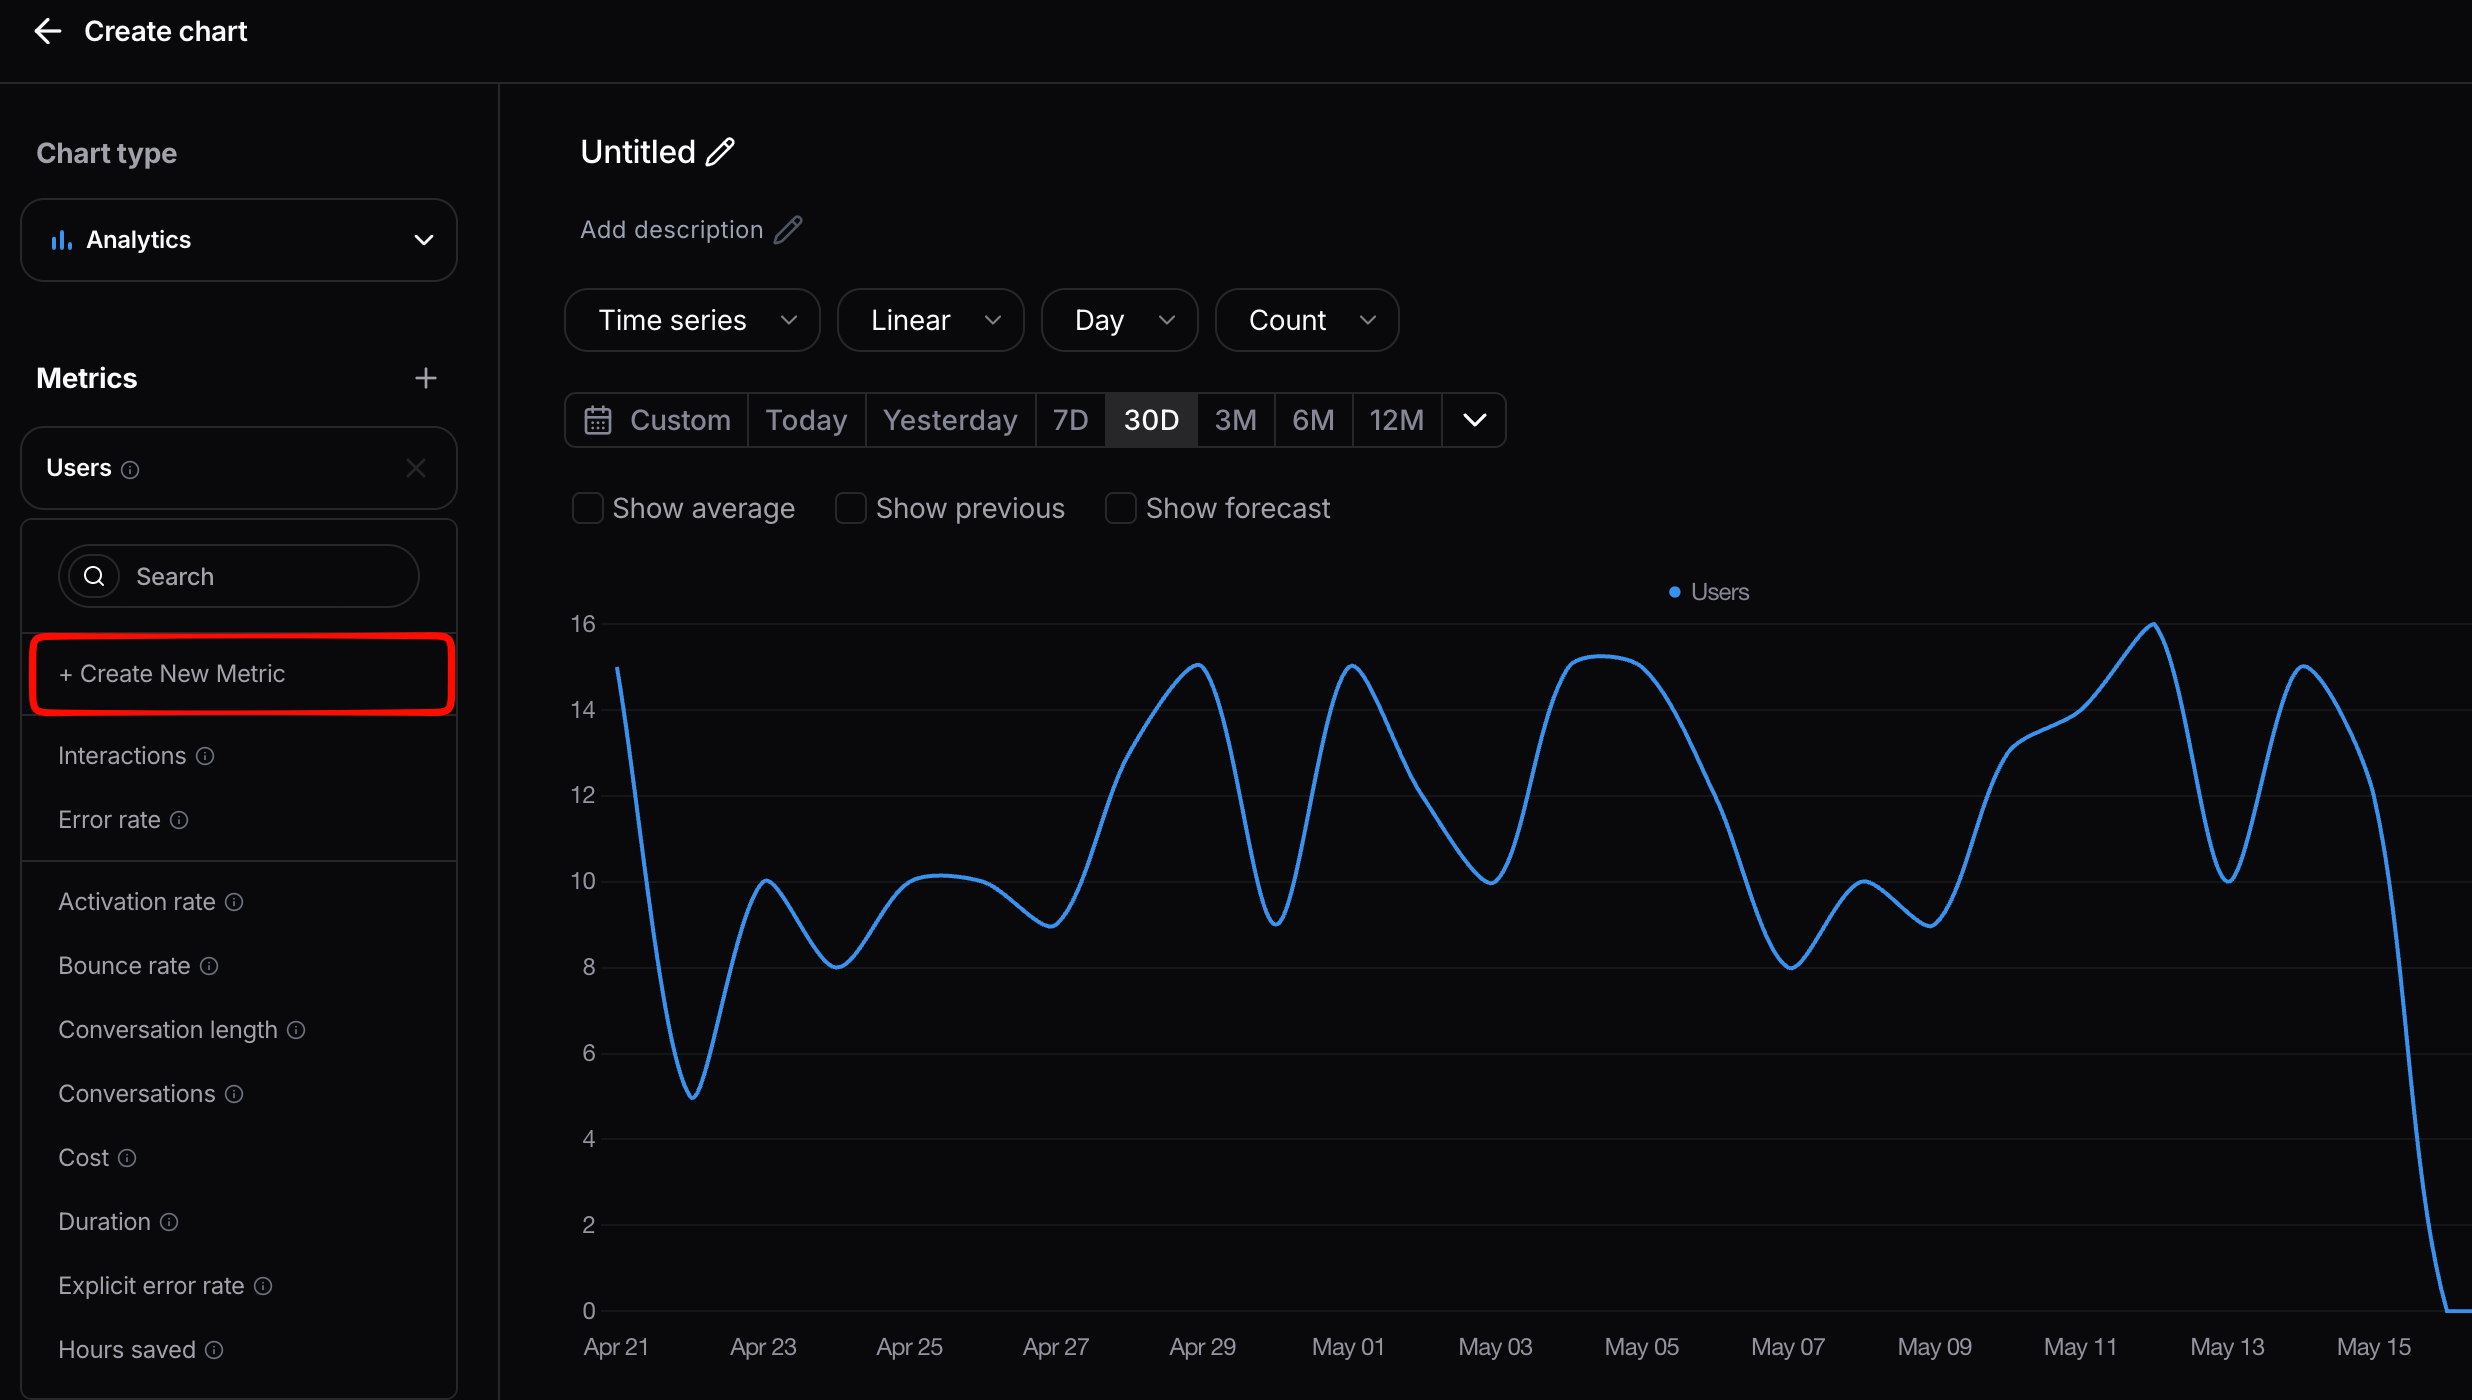
Creating a new variable

Creating a new custom variable from the Metrics panel

In the dialog that opens, give the variable a Name and, optionally, a Description. Then build the Formula: type to search for variables and press Enter or Tab to insert each one as a chip, adding operators and numbers as needed (for example, ( Interactions / Conversations ) * 100). Turn on Display as percentage if the result should be shown as a percentage, optionally add a Filter to scope the variable, then click Create.
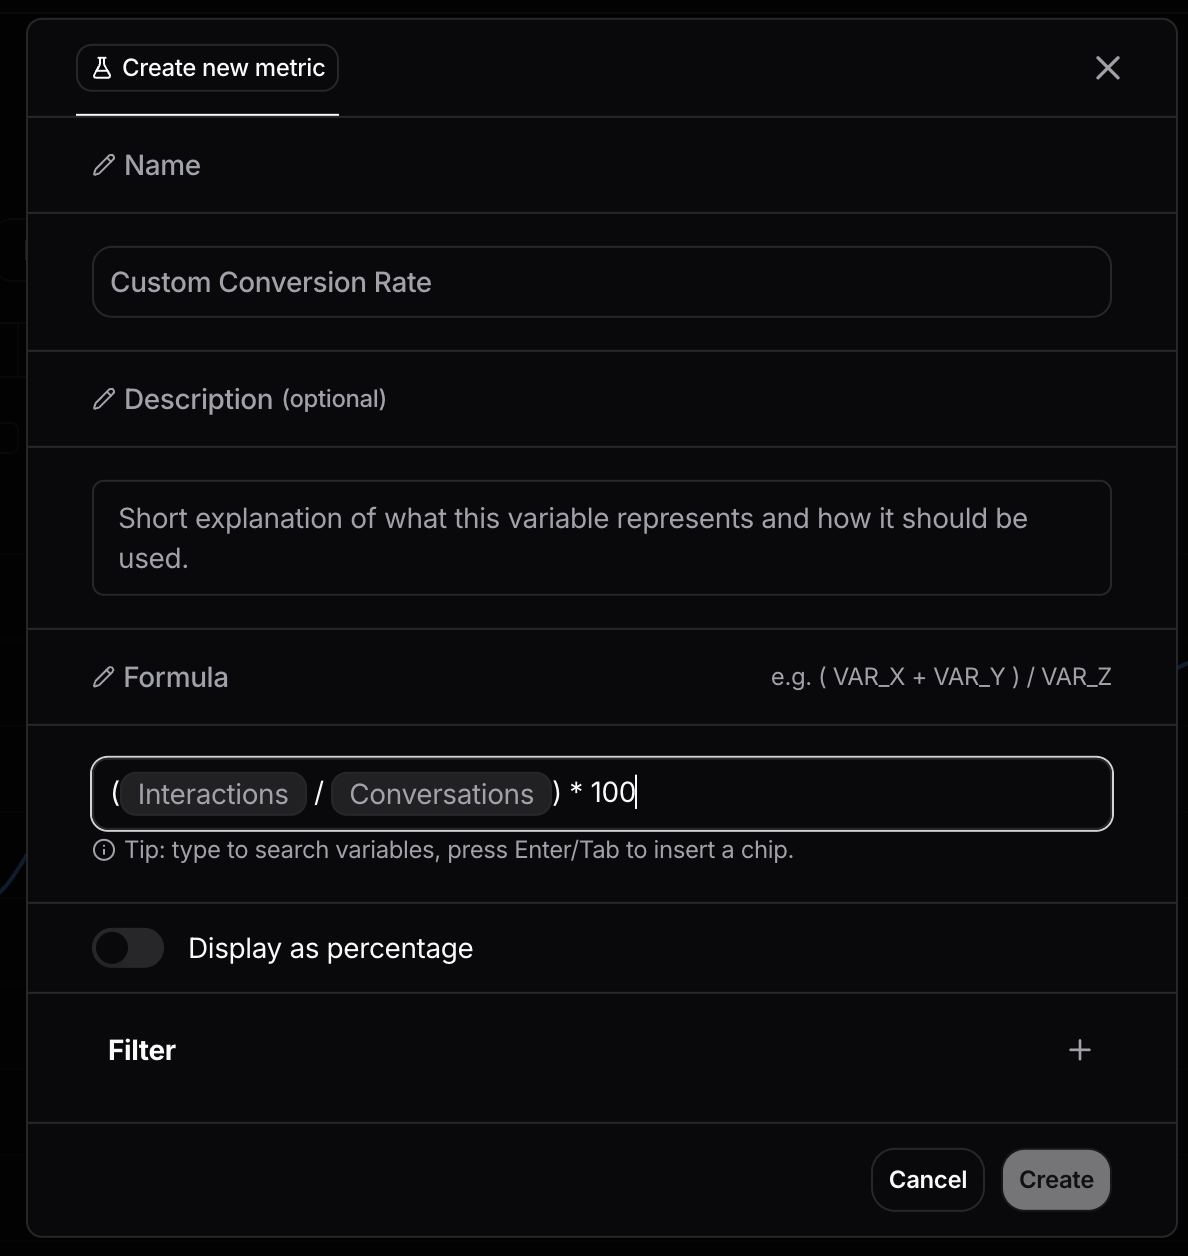
Creating a new variable, formula

Building the formula for a custom variable

The new variable is added to the chart and can be referenced inside other custom variables.

Forecasting metrics

For any time-series line chart in Reports, you can extend the chart with a forecast of where the metric is heading through the end of the current period. This is especially useful for monitoring goals (“are we on track to hit our monthly target?”) and for executive reports where the audience cares about the trajectory, not just the historical line.