When to use events
- Mark releases. Tag the day you shipped a new model version, prompt, or RAG pipeline so you can see whether sentiment, error rate, or task completion changed afterwards.
- Mark marketing or onboarding pushes. When you run a campaign that drives new users to the AI product, an event helps explain spikes in conversation volume.
- Mark incidents. A model provider outage or a backend bug becomes much easier to investigate when it is annotated on the chart.
- Mark business milestones. Quarter ends, fiscal-year boundaries, or compliance deadlines.
Create an event
From a chart: click on the chart’s time axis at the moment you want to annotate. This is the fastest way to capture an event in the flow of analysis.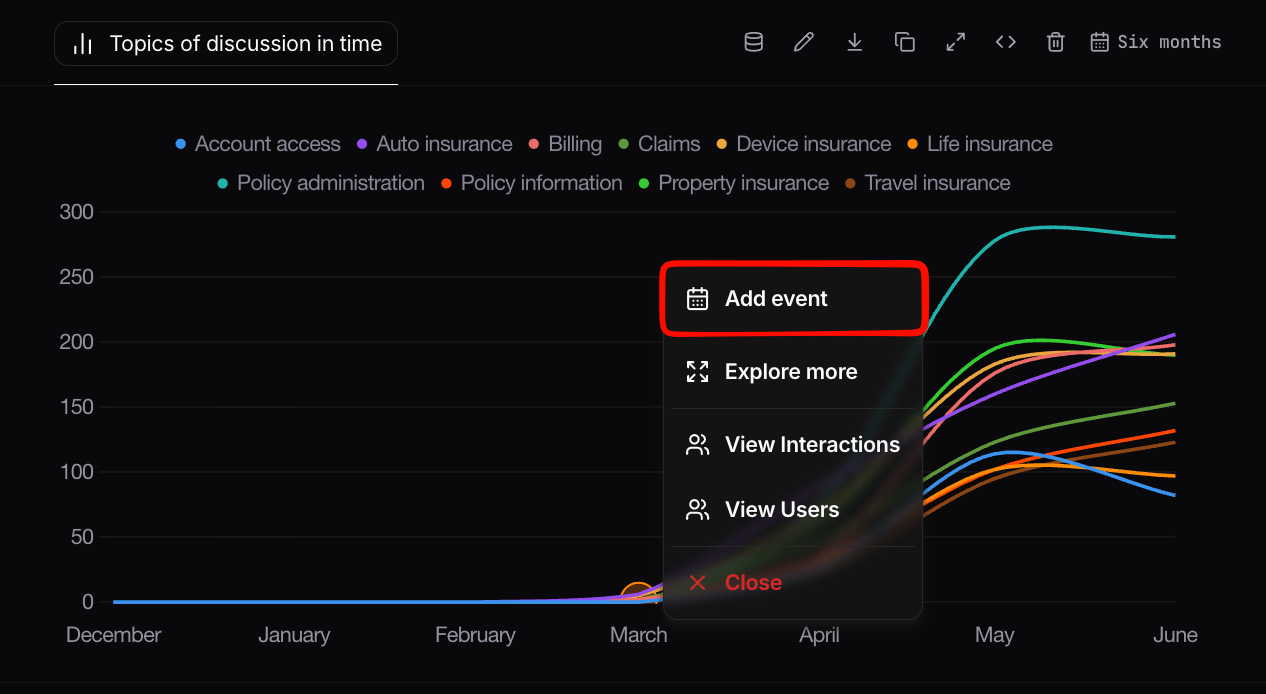
Creating an event directly from a chart's time axis
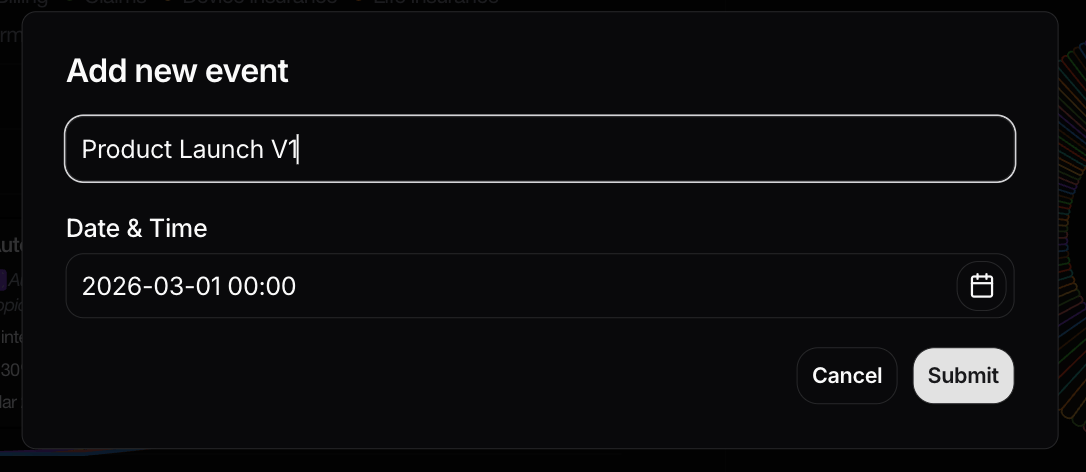
The event creation dialog
- A title (e.g.
Model upgraded to GPT-4o). - A timestamp.