

- Understand what people actually use AI for
- Identify the tasks and workflows where AI is most widely used
- Compare how different teams use AI
- Understand where users struggle to complete work with AI
How Tasks are identified
Unlike most Nebuly metrics, Tasks are not assigned at the individual interaction level. They are identified across segments of a conversation. This is because a task is often completed through several interactions rather than a single prompt and response. A user might start by asking AI to draft something, then refine it, add context, or request changes across multiple follow-up interactions. Nebuly groups these related interactions into a segment, representing the sequence of interactions that contribute to the same task. Within each segment:- One interaction acts as the main interaction, defining the primary objective of the task.
- Subsequent interactions that continue working toward that objective are treated as follow-ups and are associated with the main interaction.
- When the user’s objective changes, a new segment can begin.
The Tasks report
The Tasks report shows what users are doing with AI and how that work is distributed across your organization. For each task, Nebuly reports:- Interactions: Total interactions associated with the task
- Users: Number of unique users performing the task
- Error rate: Percentage of interactions associated with the task that resulted in an AI failure
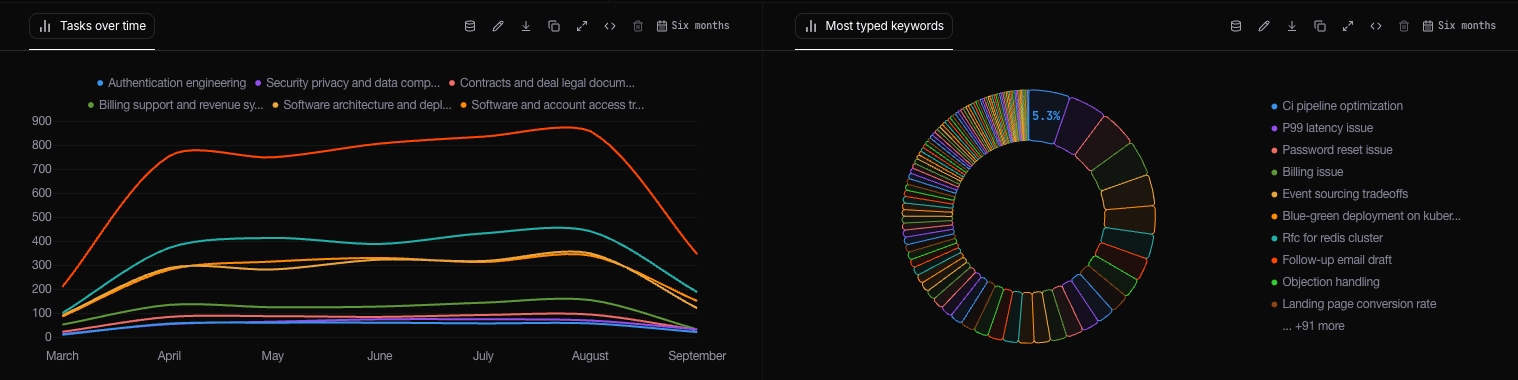
Tasks over time
Tracks how task volume changes throughout the selected period. Use it to see which types of work are becoming more common, which are declining, and how employees’ use of AI changes over time.Most typed keywords
Shows the most frequently used keywords across conversations associated with tasks. This can help you spot recurring terminology, tools, documents, processes, or business concepts that appear across the work employees delegate to AI.User intent over time
Shows how different categories of user intent evolve over time. Use it to identify seasonal trends, changes in user behavior, and shifts in how users interact with your AI.Main tasks performed
Shows the tasks employees perform most frequently with AI. Use this view to understand which types of work account for the largest share of AI usage and where AI is becoming part of regular workflows. It can also help you identify high-volume tasks worth investigating further for efficiency, quality, or automation opportunities.Build your own reports
Task dimensions are also available throughout Nebuly’s reporting engine. You can combine Tasks with your existing metrics, filters, and groupings to analyze how AI is used across teams, projects, business units, or other user segments. For example, you can build reports to understand:- Which tasks are performed most frequently with AI
- How the task mix differs across teams
- Which tasks are growing fastest over time
- Which tasks have the highest failure or abandonment rates
- Which models or AI applications are used for specific types of work
- How AI spend, proficiency, or productivity differs by task