The Nebuly MCP Server is currently in beta and available to all SaaS users and self-hosted customers.SaaS customers can connect directly using
https://mcp.nebuly.com/mcp.SaaS customers with custom authentication URL should contact their Nebuly representative to enable MCP access.
Once enabled the url should be https://<YOUR_AUTH_URL>/mcp.Self-hosted customers should contact their Nebuly representative to enable MCP access.
Once enabled the url should be https://<YOUR_AUTH_URL>/mcp.Prerequisites
Before you configure the integration, make sure you have:- A Nebuly account with MCP access (all SaaS users, or a self-hosted environment with MCP beta enabled).
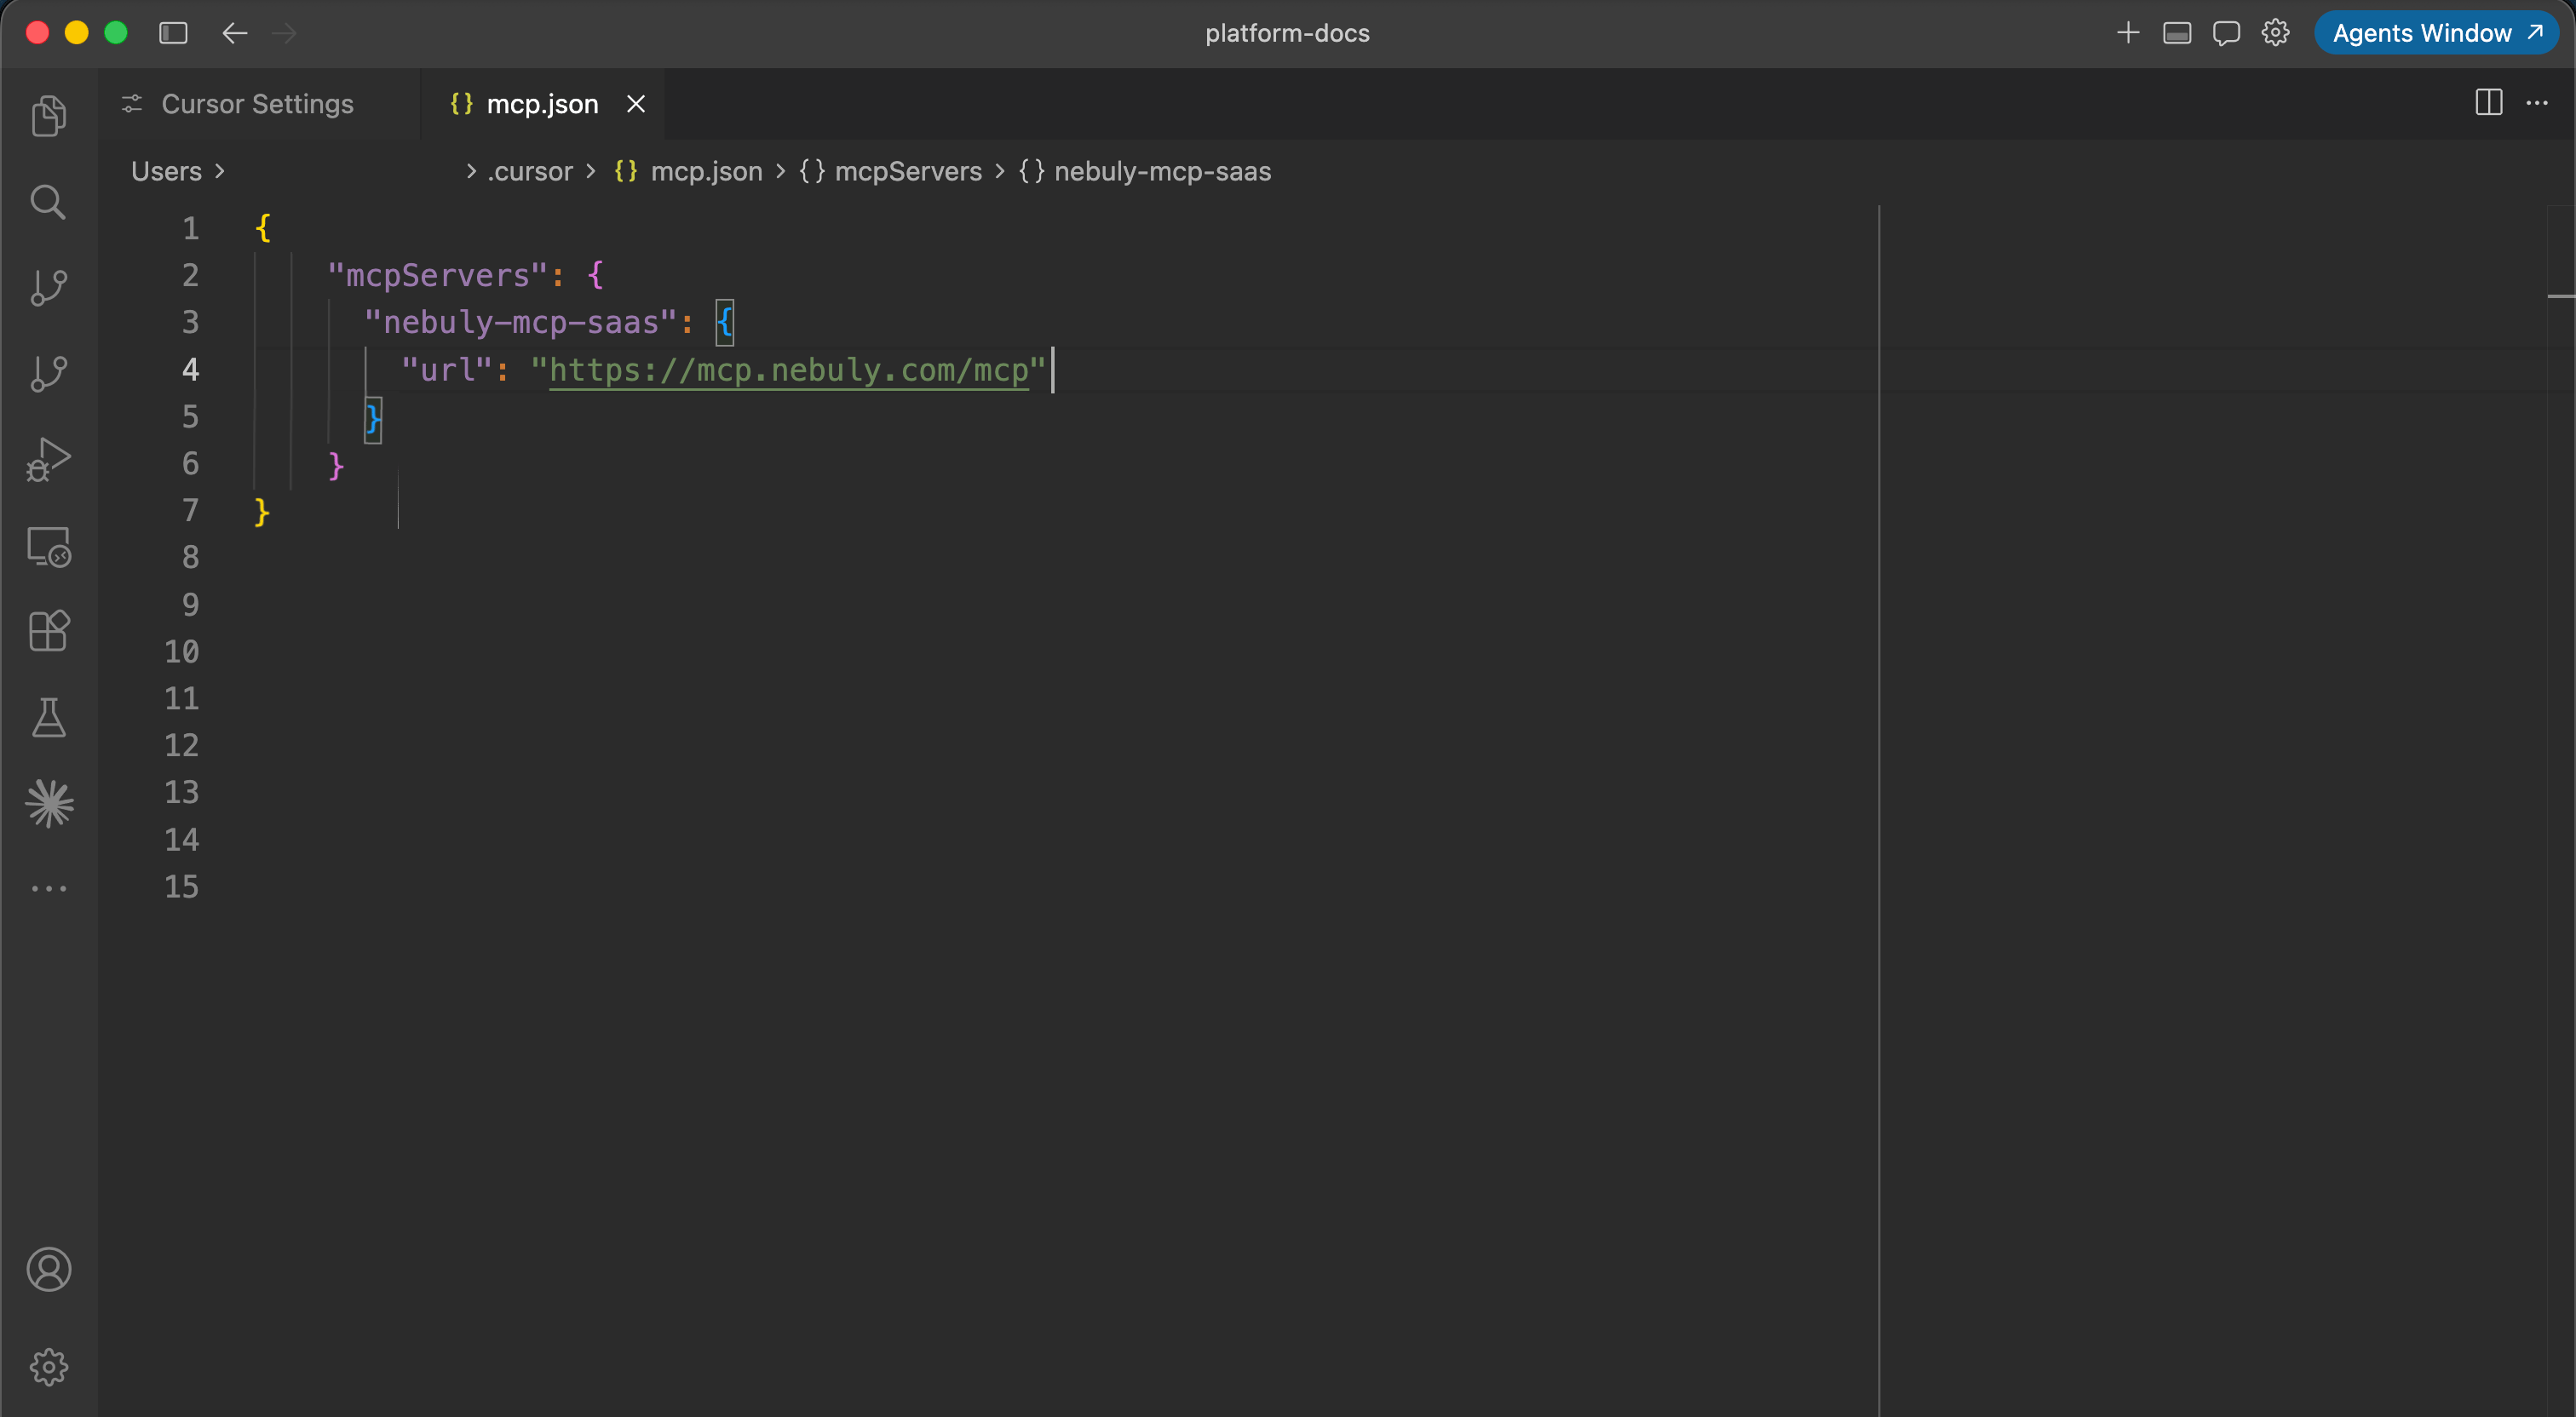
- Your Nebuly MCP server URL, shown below as
<NEBULY_MCP_URL>. SaaS users should usehttps://mcp.nebuly.com/mcp. - One of the supported MCP clients: Claude Desktop, Claude Code, or Cursor.
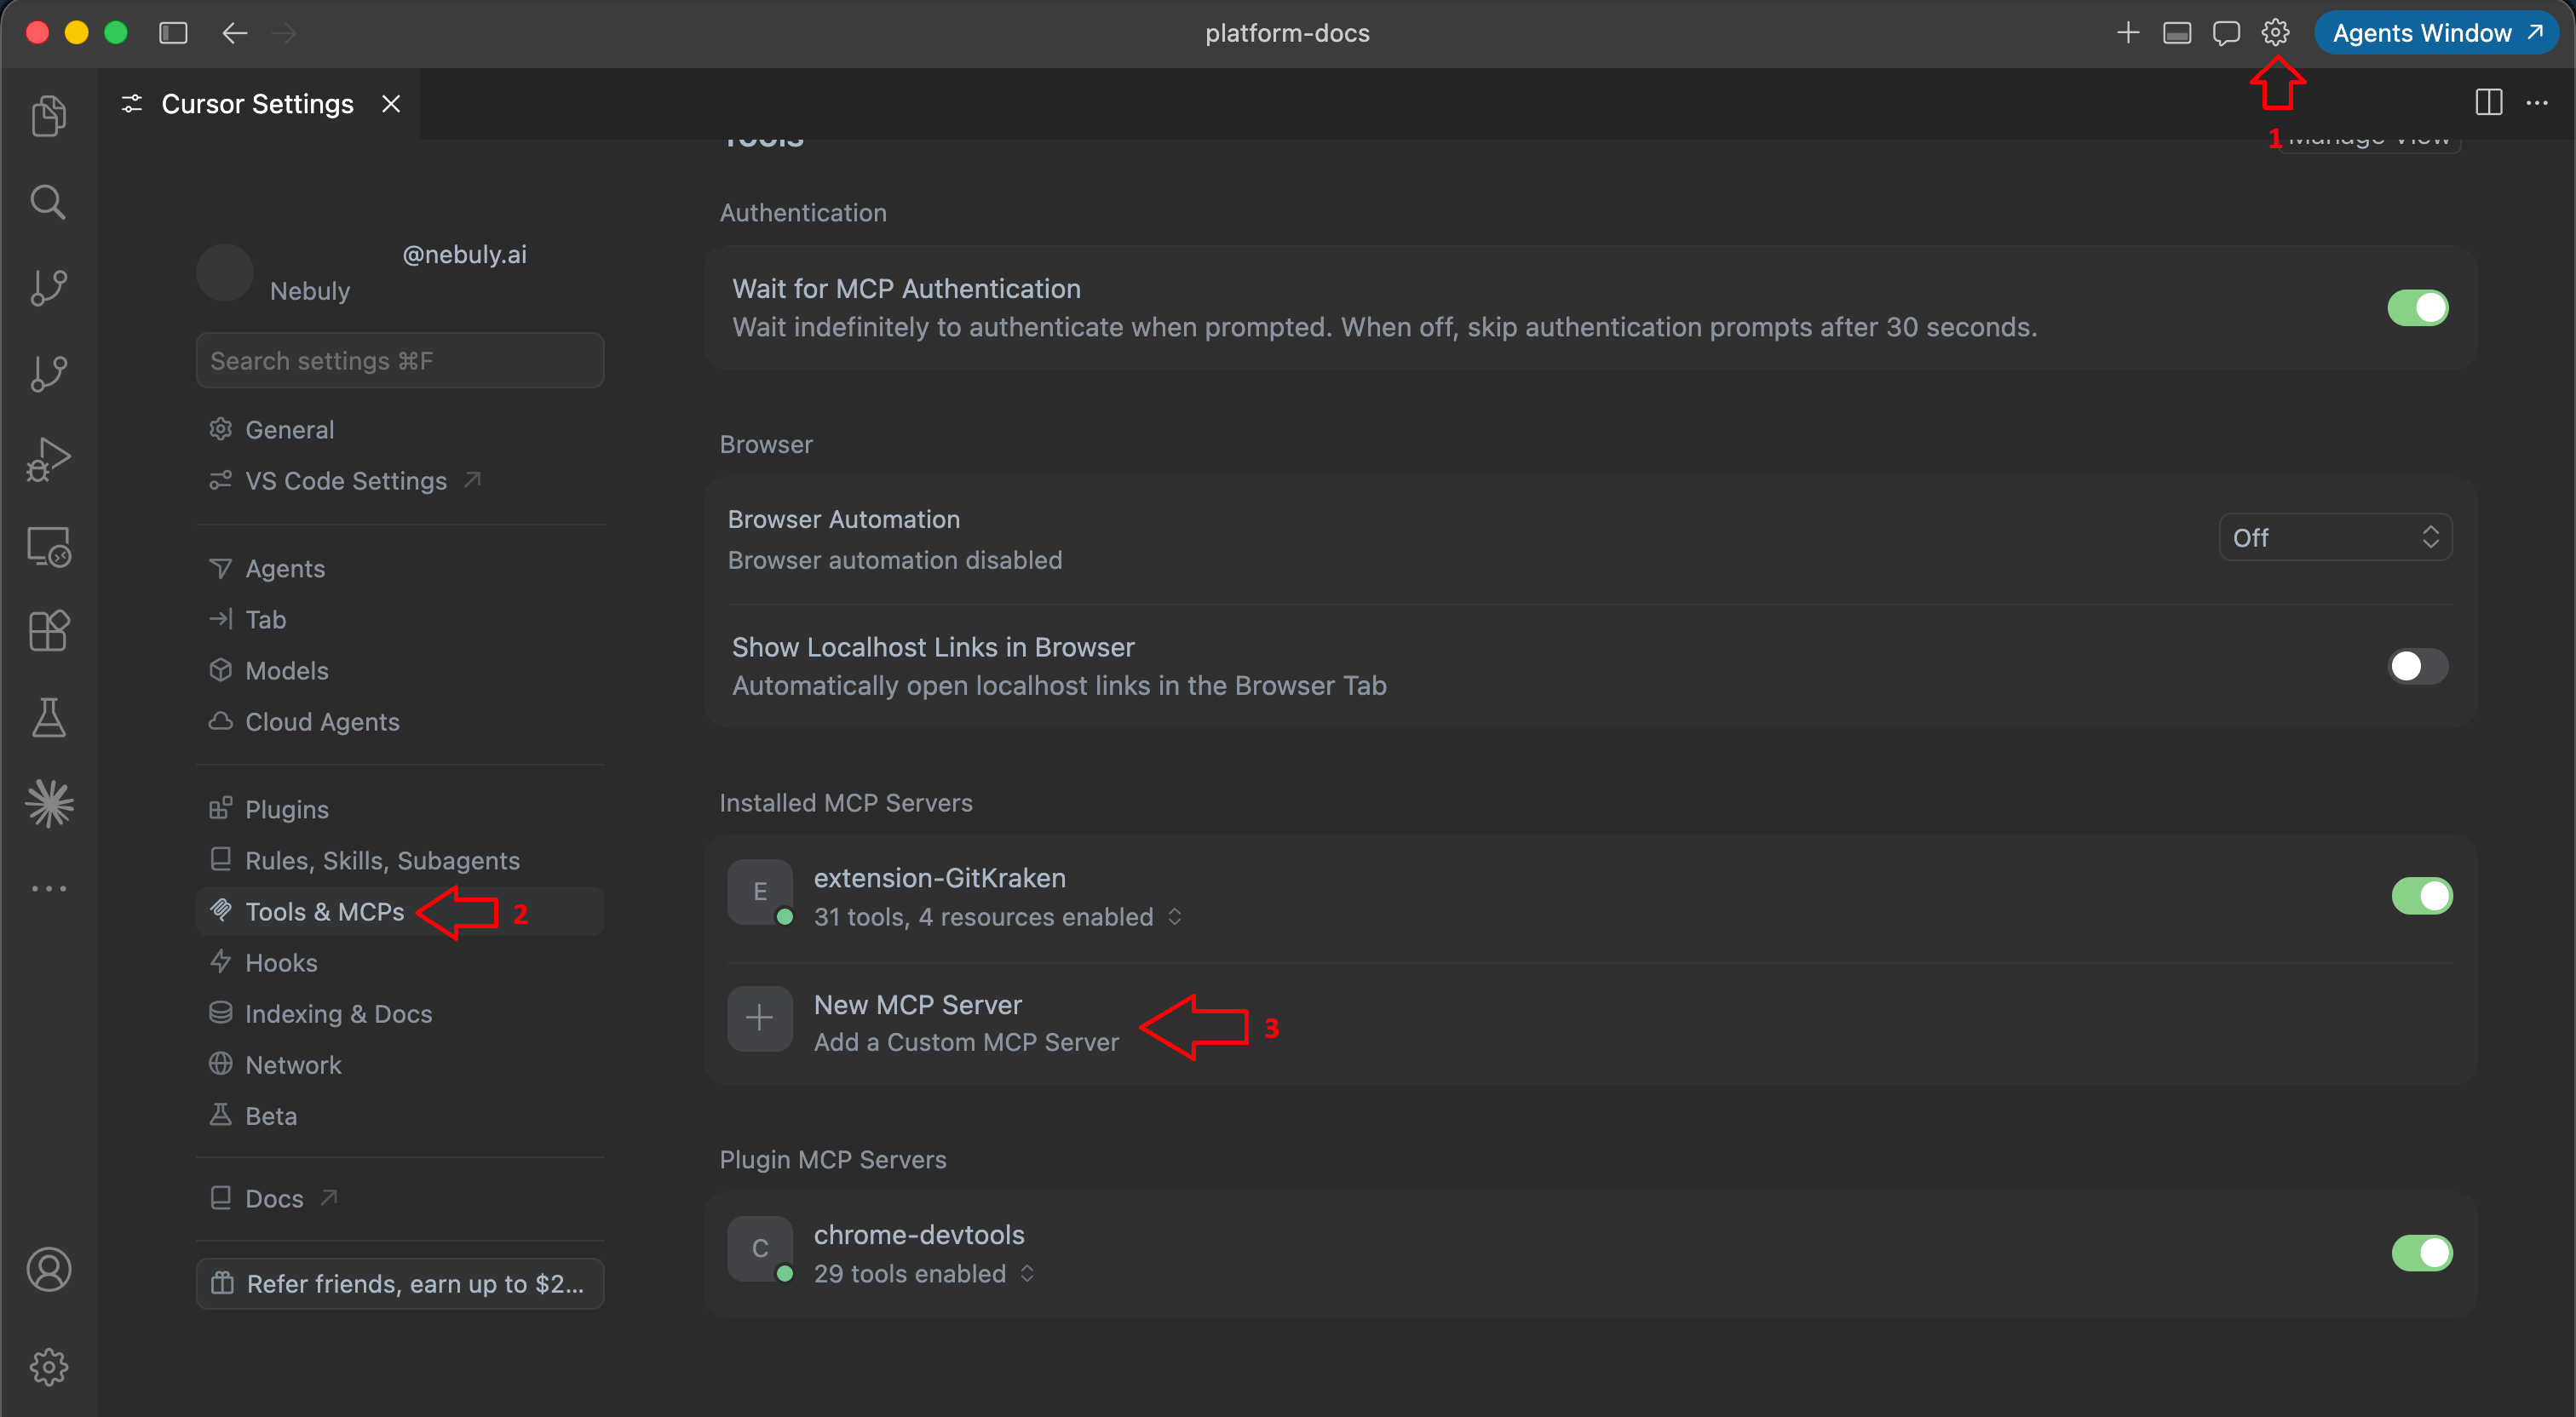
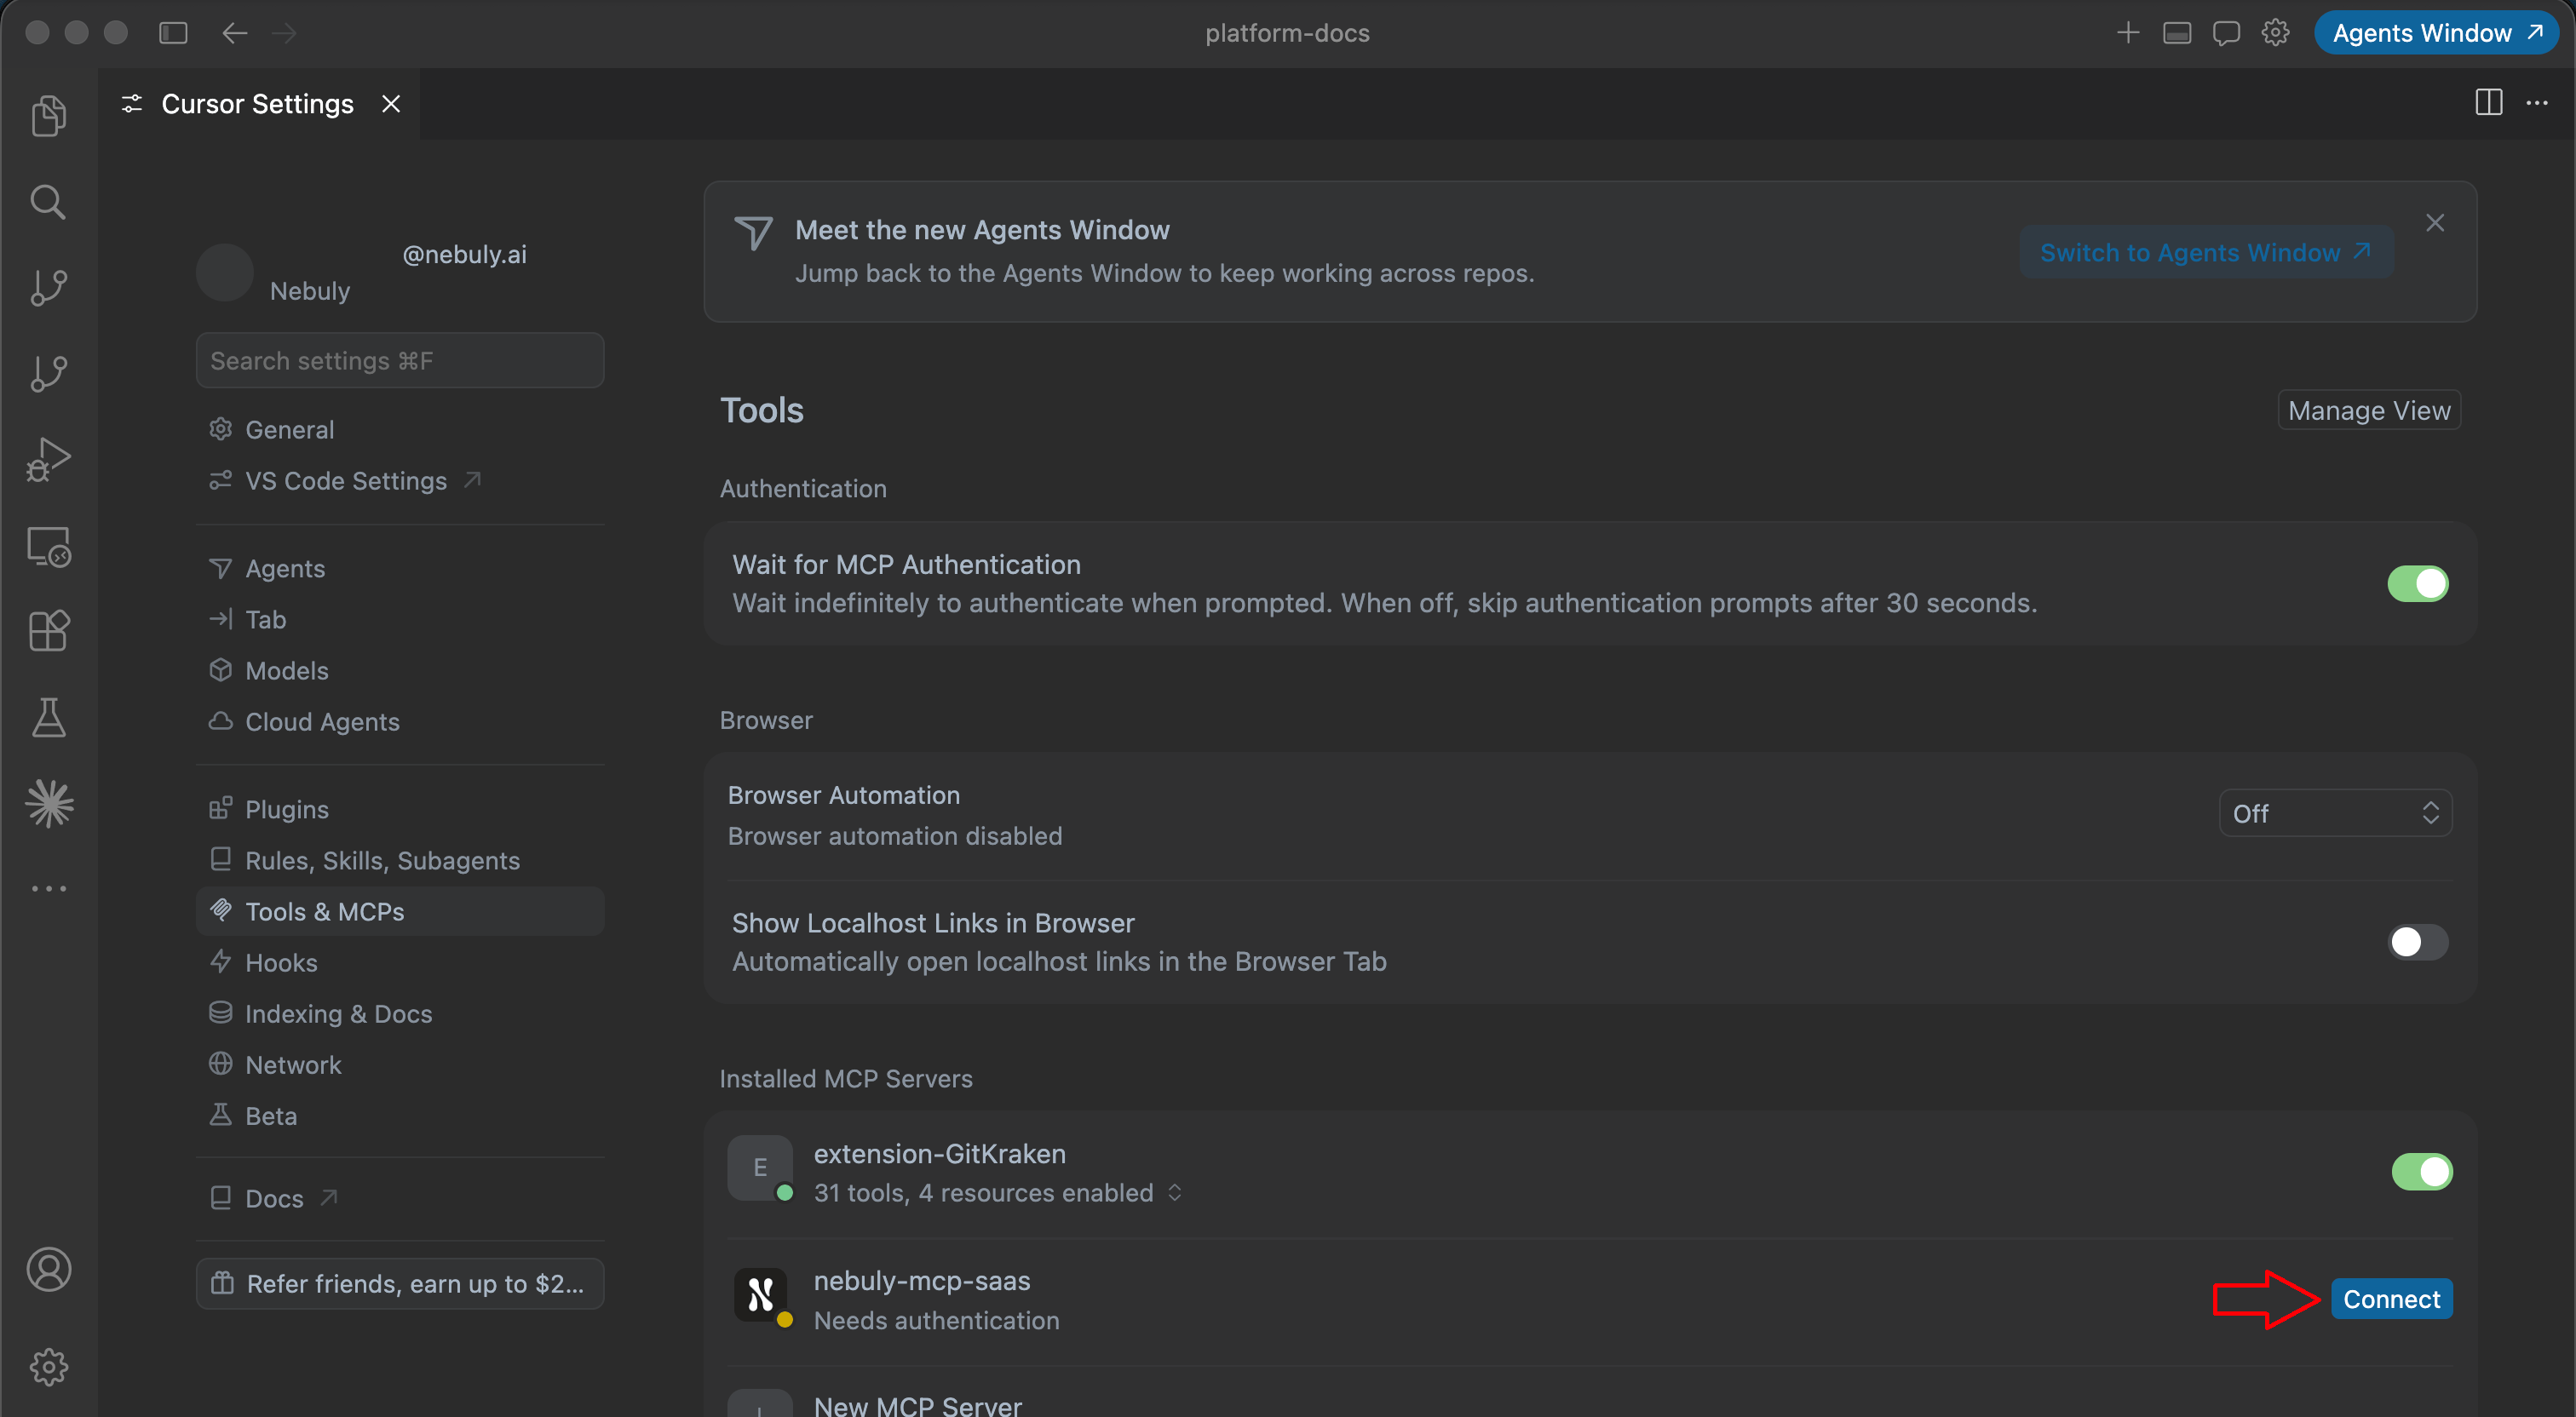
Configure your MCP client
- Claude Desktop
- Claude Code
- Cursor
Detailed instructions for adding the Nebuly MCP server to Claude Desktop can be found in the Claude Desktop documentation.This typically requires organization-level configuration, so please reach out to your Claude administrator if you don’t have access to the settings described in the documentation.
MCP Overview
Example usage
After defining a project to work with, your assistant can answer a wide variety of questions about your Nebuly data.Not all agents have access to your current position, to ensure the same results shown in the Nebuly UI provide
your location/timezone in the conversation.
- “List the Nebuly projects I can access.”
- “Show me the top 10 topics by interaction volume over the last 30 days.”
- “Show me a chart of negative-sentiment interactions by topic and user intent for the last two weeks.”
- “Show daily interaction volume and error-rate trends for the last quarter.”
- “Which topics have the highest average latency this month?”
- “List the reports in the project.”
- “Create a report called ‘Monthly Quality’ and add a line chart of daily interaction volume for the last 30 days.”
- “Add a pie chart of interactions by topic for last month to my ‘Monthly Quality’ report.”
- “Export January interactions with timestamp, user, input, output, topic, sentiment, and cost.”
Available tools
Interactions and conversations
list_projects: List the Nebuly projects your assistant can access.get_interactions: Query interactions in a project with filters. Results will be paginated and limited, this tool is designed for browsing and inspecting small sets of interactions, not for bulk data retrieval.get_interaction_details: Retrieve the full record for a single interaction, based on an interaction ID.get_conversation_detail: Fetch the full conversation history based on a conversation ID.
Analytics
get_interaction_aggregates: Group interactions by one dimension, such as topic, sentiment, user intent, language, feedback, risk type, or custom fields.get_interaction_multi_aggregates: Break down interactions across multiple dimensions, such as topic by sentiment or intent by feedback.get_interaction_time_series: Build trends over time with minute, hour, day, week, month, or year buckets.get_interaction_query_options: Used by agents to discover how to filter and group interactions.
The analytics tool gets best result when used from assistants that can handle tabular data and charts, such as Claude Desktop or Cursor.
Reports and charts
list_reports: List the reports in a project.get_report: Fetch a single report with its full configuration and charts.create_report: Create a new report in a project.update_report: Update an existing report’s metadata or favorite status.create_analytics_chart: Add an analytics chart to a report.update_analytics_chart: Update an existing analytics chart.create_table_chart: Add a table chart to a report.update_table_chart: Update an existing table chart.get_chart_builder_options: Used by agents to discover how to build charts.get_filter_values: Used by agents to discover the distinct selectable values for a given chart filter.get_filter_definition: Used by agents to discover specific details about a chart filter.
Currently the MCP server supports the following chart types:
- Time series
- Horizontal bar chart
- Stacked time series
- Metric
- Time series distribution
- Scatter plot
- Pie
- Table
Exports
get_interactions_csv: Start an async CSV export for a filtered set of interactions. By default the export will include timestamp, input and output. You can ask your assistant to include additional fields such as user, topic, sentiment or cost.get_csv_export_status: The agent will use this to check the status of a running export job. Returnspending,running,completed, orfailedwith a progress percentage.prepare_csv_download: The agent will use this to obtain a time-limited download URL. The URL expires after 5 minutes.
Exporting CSVs works best with assistants that can handle automatic downloads, such as Claude Code or Cursor.