

What business value is our AI actually generating?Most organizations measure AI adoption using metrics such as active users, conversations, or requests processed. While these metrics show that employees are using AI, they don’t demonstrate whether AI is creating measurable business impact. Without a clear way to quantify value, it’s difficult to:
- Justify AI investments and renewals.
- Prioritize AI initiatives.
- Compare performance across teams or projects.
- Measure whether AI adoption is actually improving productivity.
- Quantify time saved across your organization.
- Measure the financial impact of AI adoption.
- Identify the AI use cases generating the highest ROI.
- Compare ROI across projects, teams, or business units.
How AI ROI works
Nebuly analyzes successful AI conversations and estimates how much work was completed by the AI instead of a human. For every interaction and conversation, Nebuly calculates:- Success — whether the conversation meets your configured success criteria and should be included in the ROI calculation.
- Time saved — the estimated time a person would have spent completing the same task manually.
- Value saved — the monetary value of that time based on your configured average hourly cost.
ROI = Time Saved * Net Hourly Cost
Enabling ROI is what triggers the AI analysis of conversations, and it is scoped to your project only. Leave it off for projects where economic value tracking is not relevant.
Monitor your ROI
You can access your ROI by visiting the ROI product in the left sidebar. There, you can monitor the ROI of your whole organization or break it down by team, market, or tenure to compare performance and identify opportunities.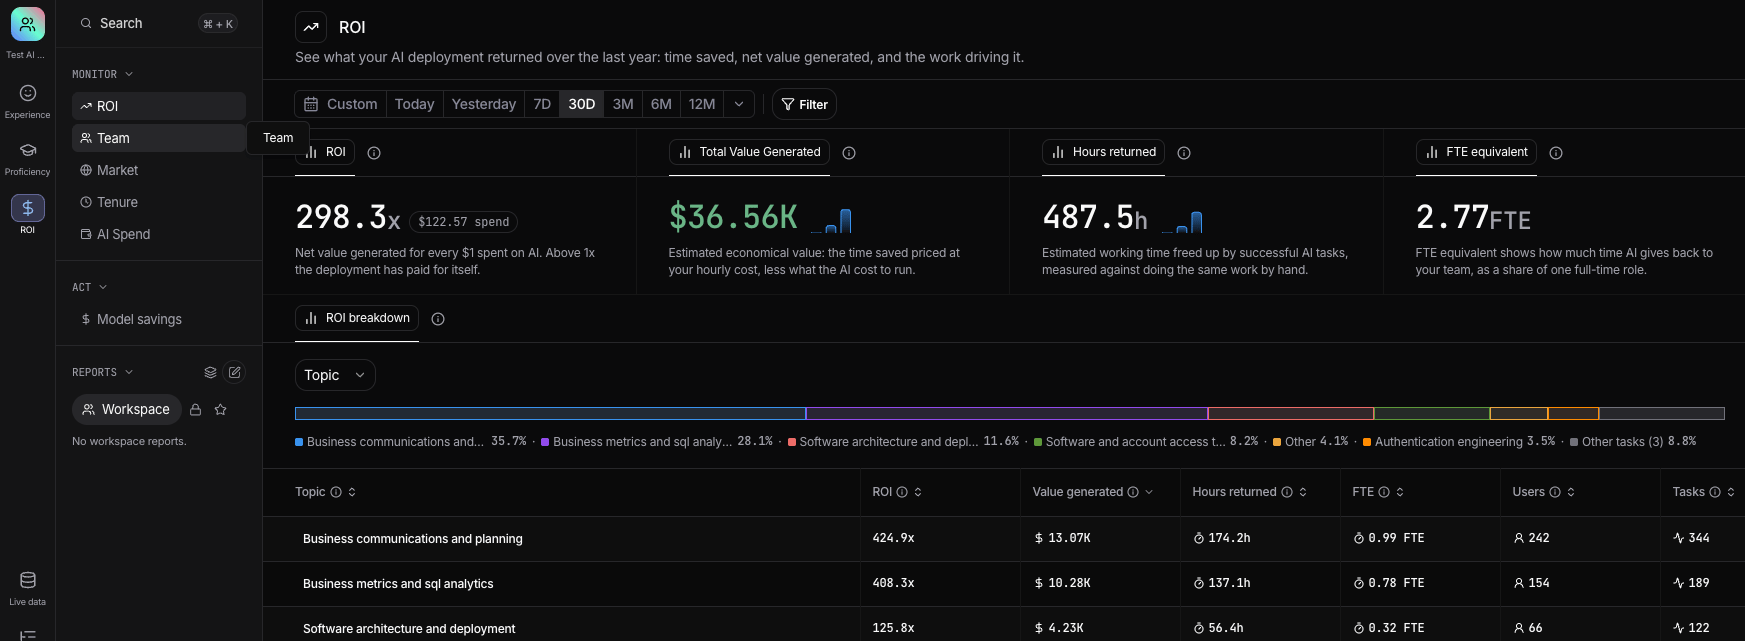
ROI
Shows the amount of net value generated for every $1 spent on AI. This metric helps you understand the efficiency of your AI investment and whether the value created by AI outweighs its execution cost.Total value generated
Shows the estimated economic value generated by AI during the selected period. It combines the value of the time saved by successful AI-assisted work with the cost of running the AI, giving you a net view of the financial impact of your deployment.Hours returned
Shows the estimated number of working hours returned to your team through successful AI-assisted tasks. This represents time employees no longer need to spend completing the same work manually and can instead reallocate to other activities.FTE equivalent
Expresses the total time returned by AI as an FTE equivalent. This makes it easier to understand the scale of the productivity impact by translating saved time into the equivalent share of full-time employee capacity.ROI breakdown
The ROI breakdown helps you understand which parts of your AI usage are responsible for the value generated. You can break down ROI by dimensions such as task, model, team, and market and compare each group across:- ROI — Net value generated for every $1 spent on AI
- Value generated — Total estimated economic value created
- Hours returned — Estimated working time saved
- FTE — Returned time expressed as full-time employee capacity
- Users — Number of unique users associated with the work
- Tasks — Number of tasks performed
Building your own ROI reports
All AI ROI metrics and dimensions are available throughout Nebuly’s reporting engine, allowing you to build custom reports tailored to your business. You can combine ROI metrics with existing metrics, filters, and groupings to answer questions such as:- Which AI use cases generate the highest ROI?
- Which departments save the most time?
- How has ROI evolved over time?
- Which teams generate the greatest business value from AI?
- Which topics or user actions have the highest task completion rate?
- Which AI agents deliver the greatest economic impact?