The Interactions page displays every interaction captured by Nebuly. Each row represents a single exchange between a user and your AI application, making it the starting point for investigating user behavior, troubleshooting AI responses, and understanding the data behind your reports. Related interactions are automatically grouped into conversations, allowing you to move seamlessly from an individual exchange to the complete conversation it belongs to. Read more about conversations here. Unlike reports, which aggregate data into charts and metrics, the Interactions page lets you inspect the raw events that make up those insights. Interactions are made of 2 elements:
  • Input — The request sent to your AI application for the interaction, typically the user’s message or prompt.
  • Output — The response generated by your AI application for that interaction.
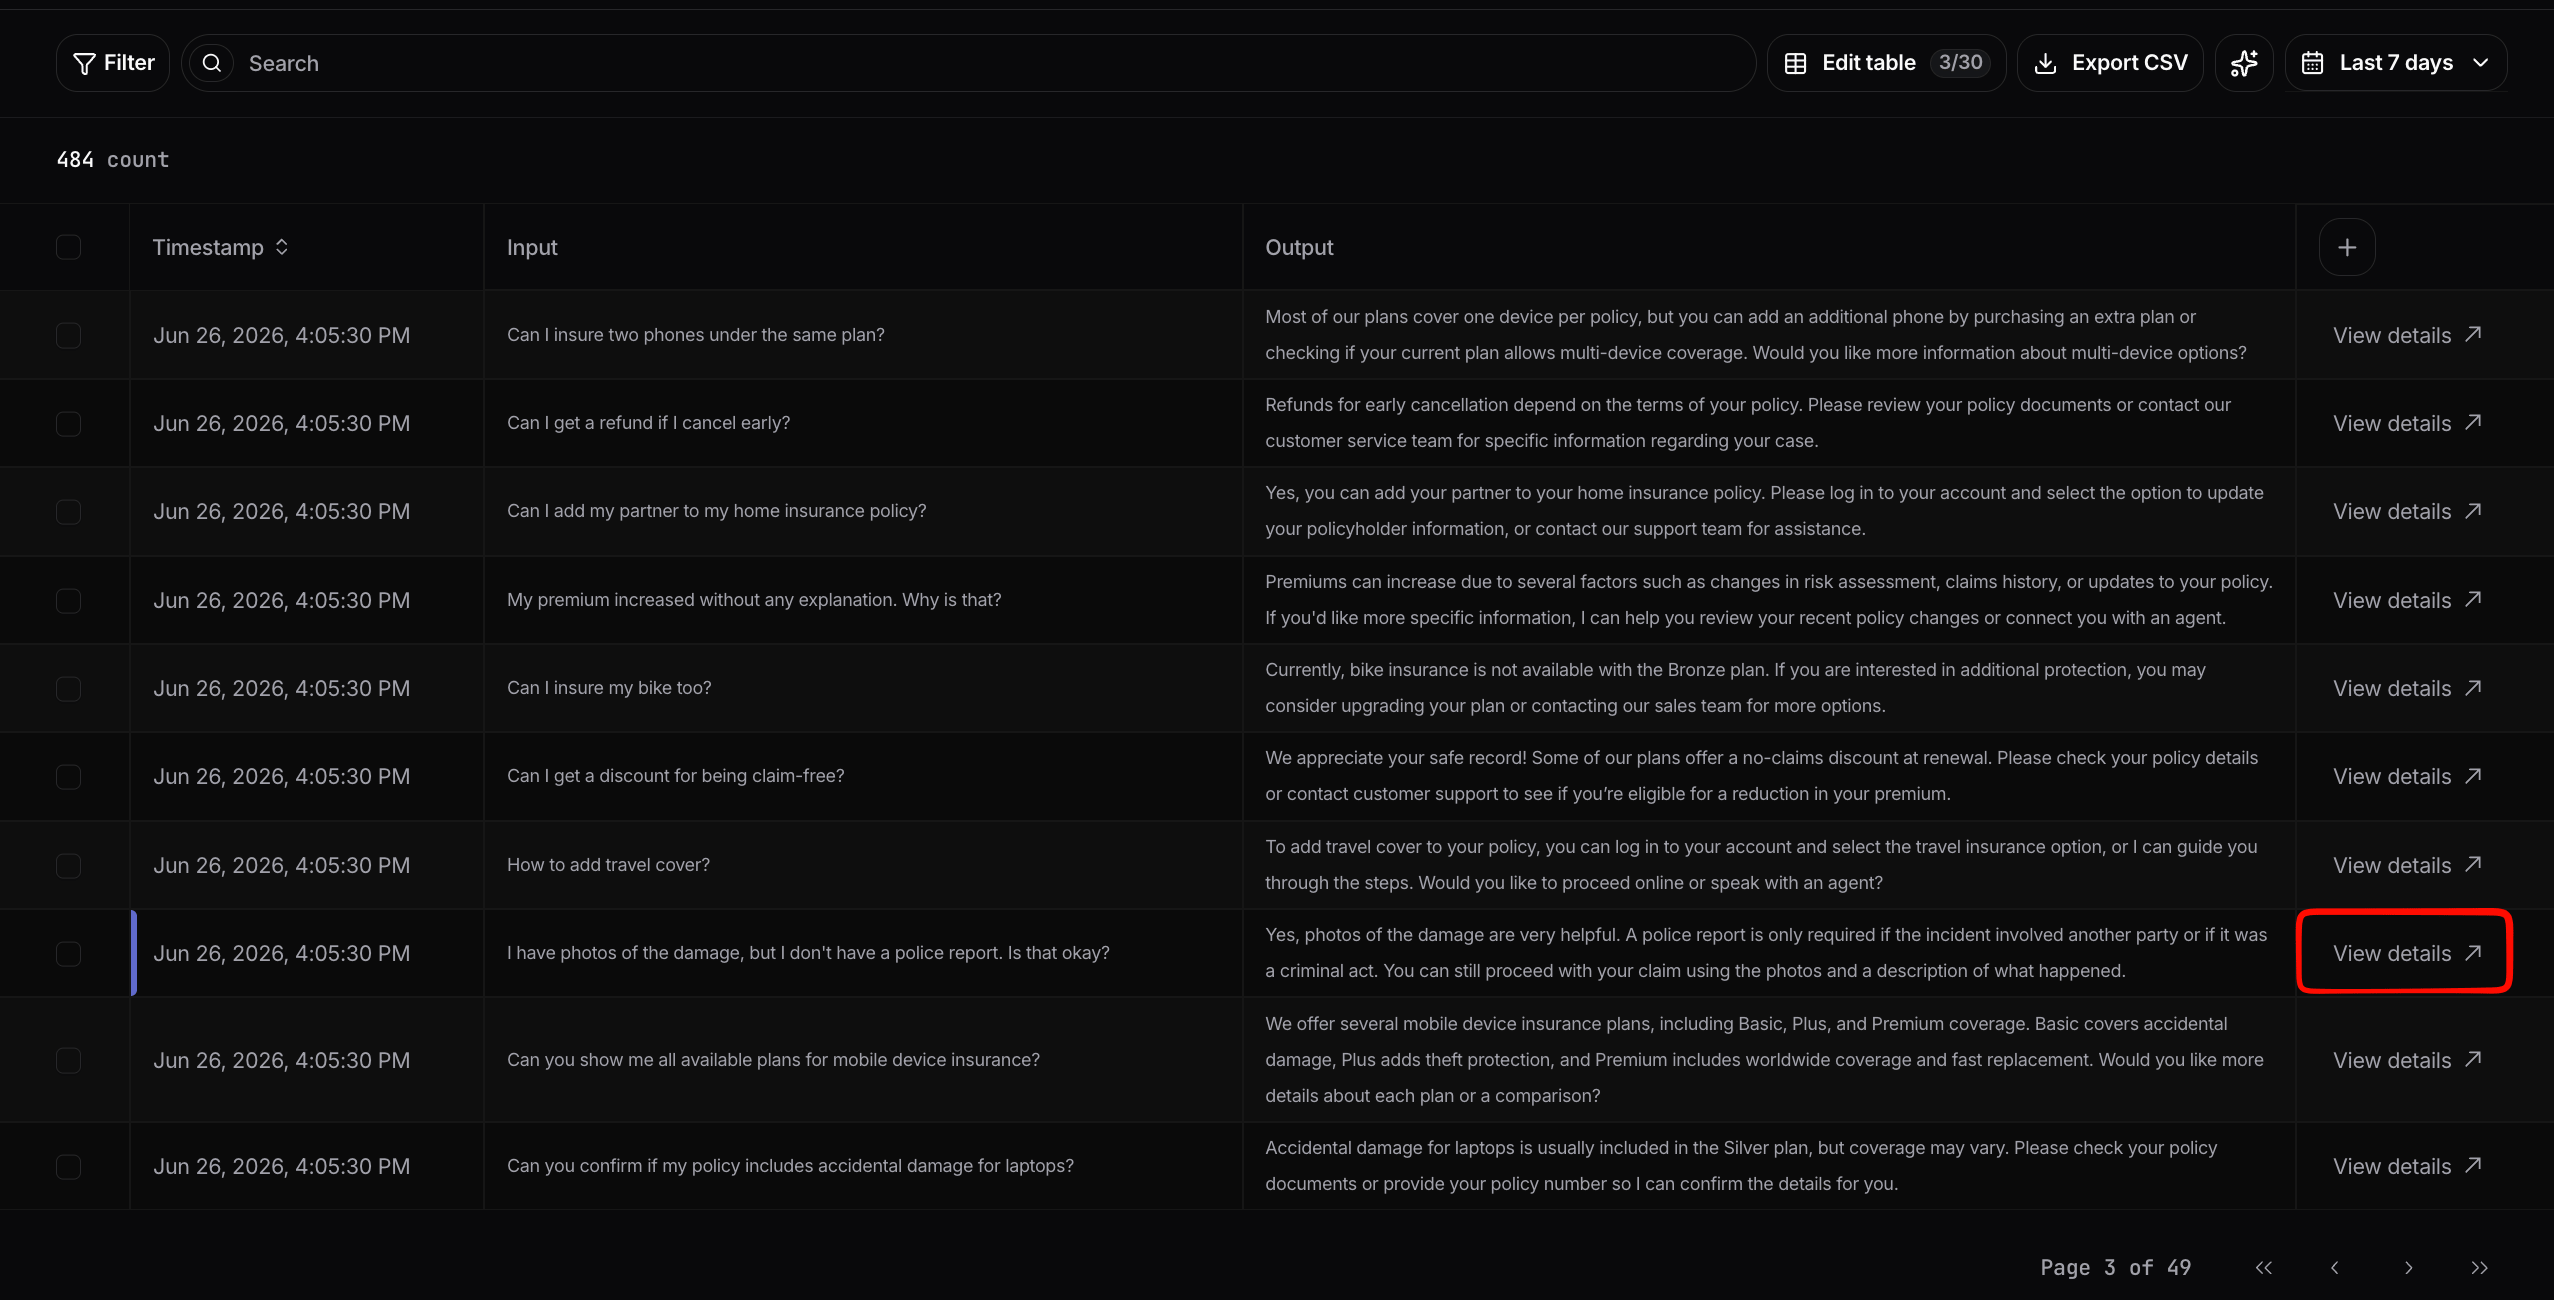
Every interaction in a Live Data table can be opened on its own to investigate it in full. Click View details in the last column of a row to open the interaction view.
View details link in the Live Data table

Open an interaction from the table with View details
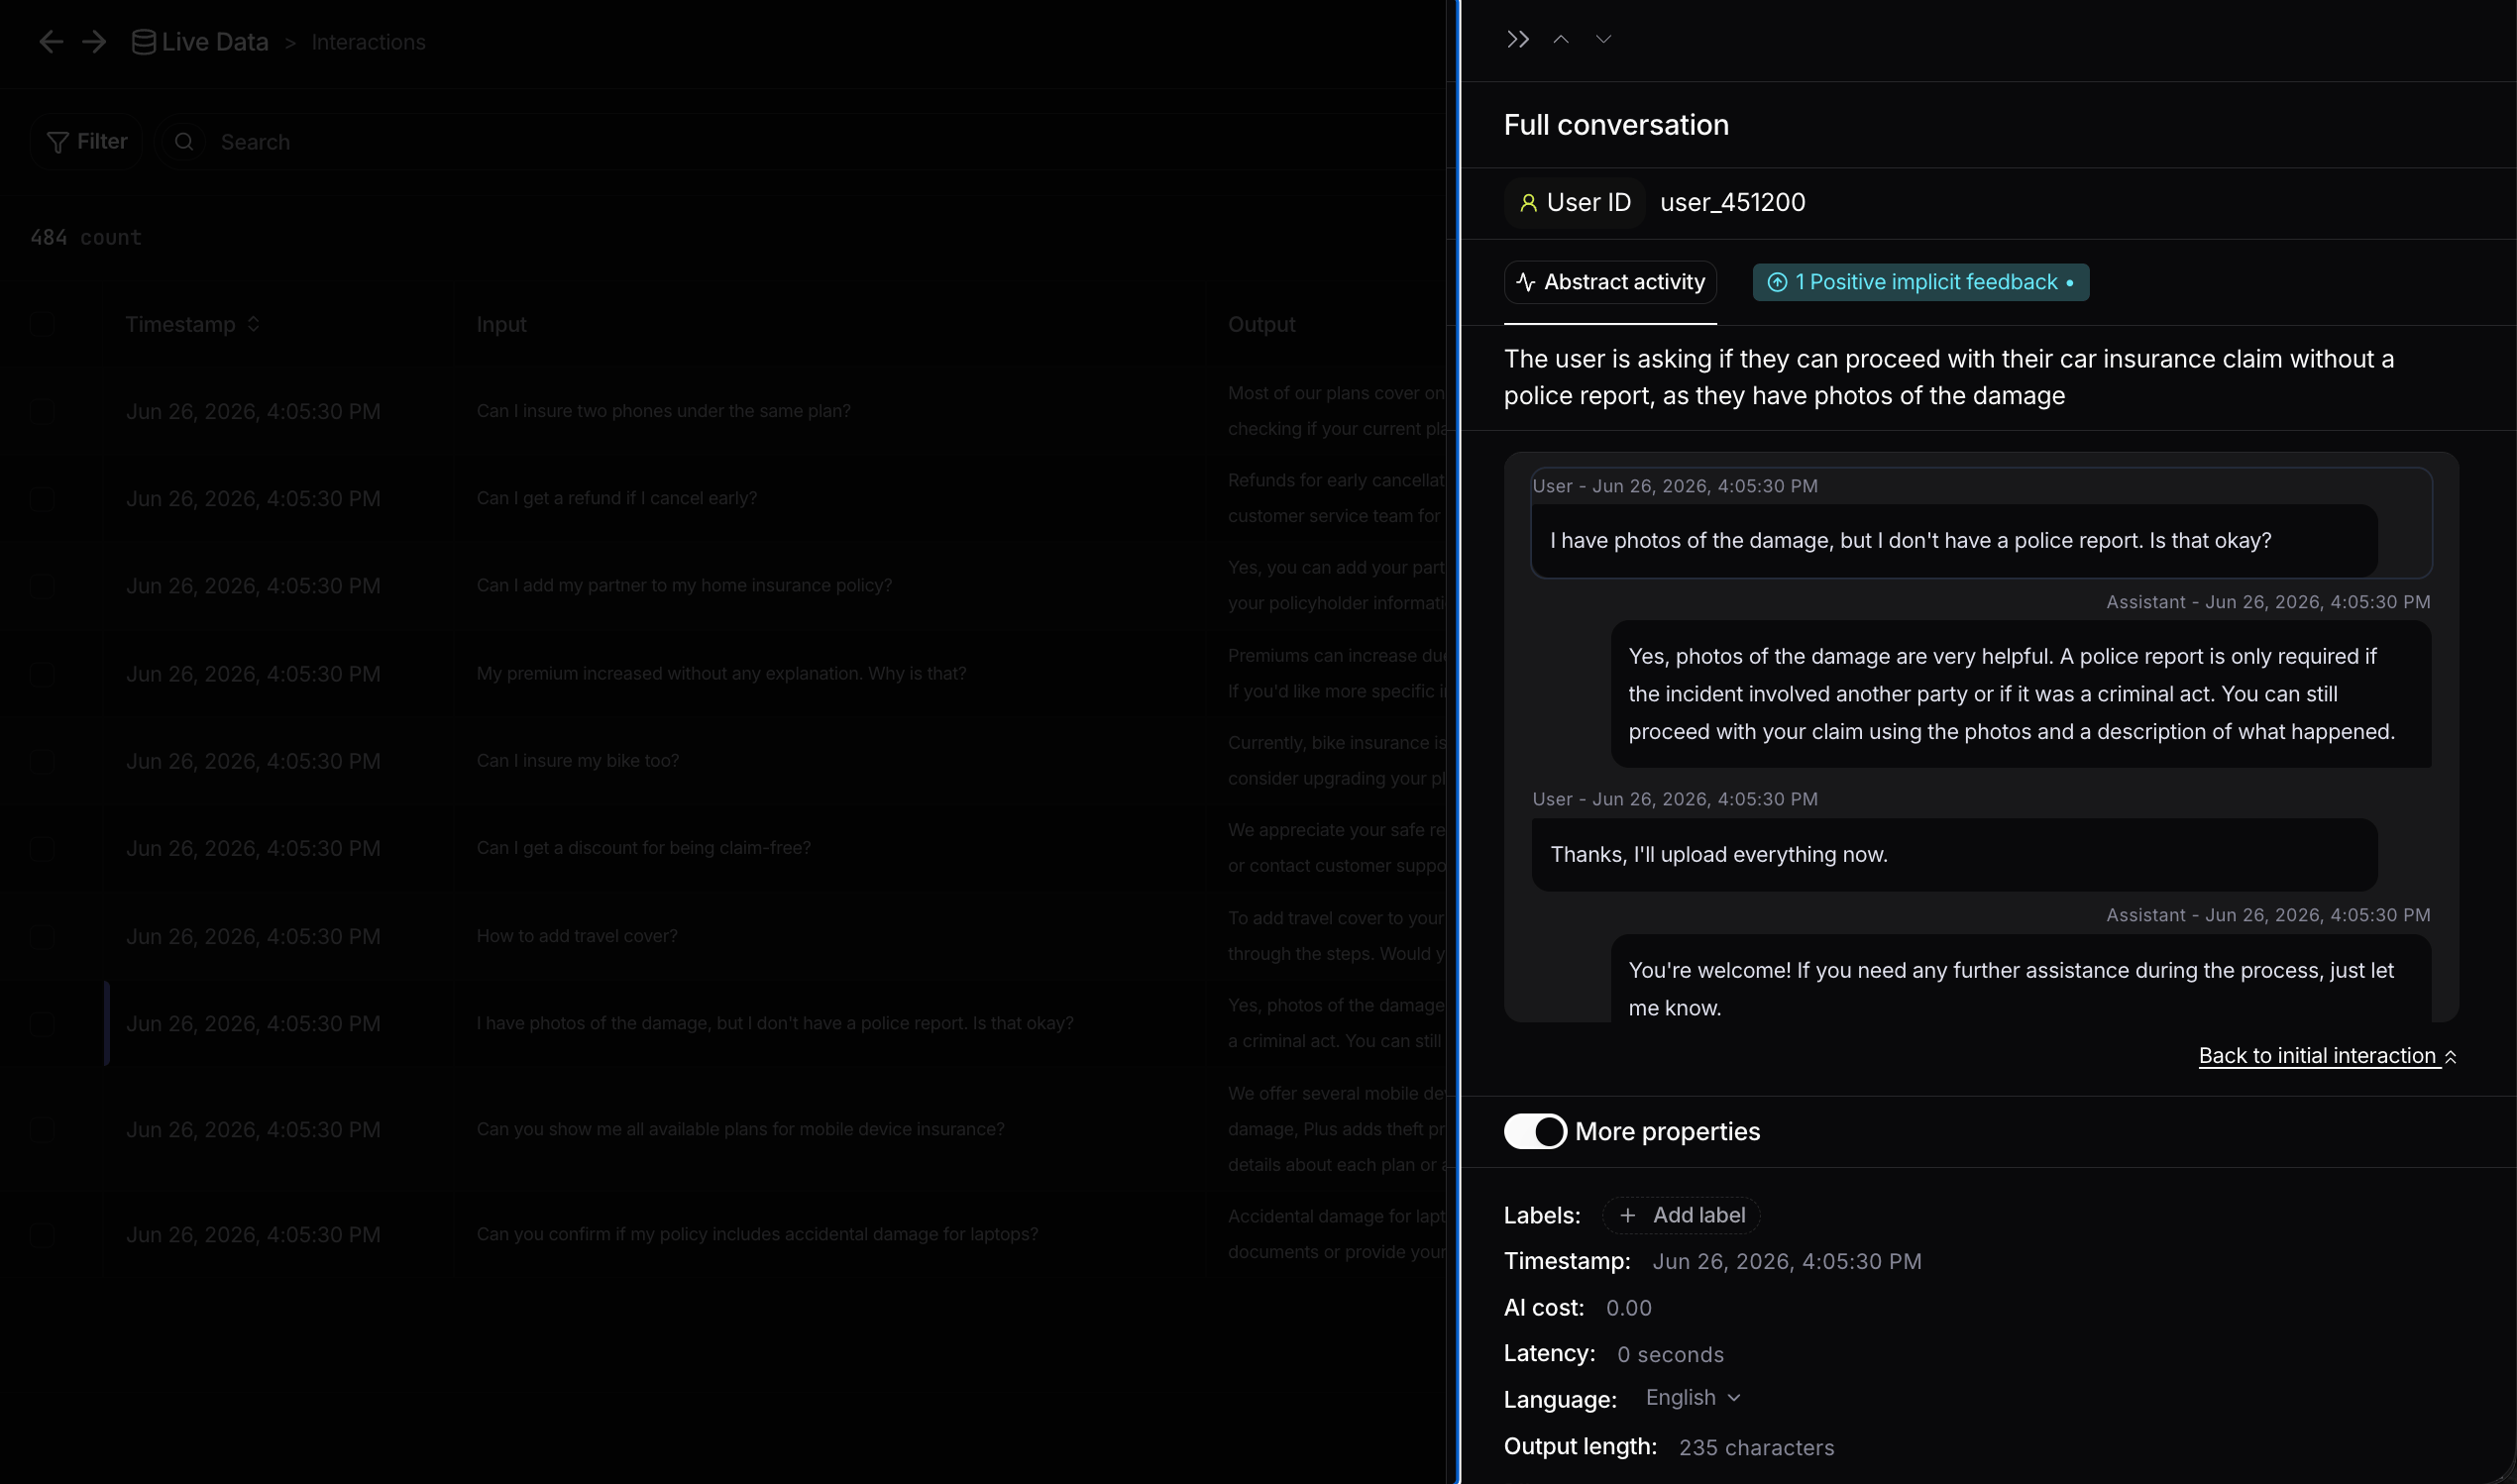
The interaction view opens as a panel showing the full conversation: the user ID, any feedback or activity tags, an AI-generated summary of what the user is trying to do, and the complete message thread between the user and the assistant with timestamps. You can scroll through every turn and use Back to initial interaction to return to the message you started from.
Interaction view showing the full conversation and properties

The full conversation and key properties in the interaction view

Expand More properties to see everything Nebuly knows about the interaction, so you can investigate it without leaving the panel. This includes:
  • Quality and feedback signals: user feedback, user sentiment, user emotions, and PII detection.
  • Intent and context: the detected topic, intent, user action, and business risk.
  • Failure intelligence: add or review the type of problem for the interaction (see Failure Intelligence).
  • Technical metrics: AI cost, latency, language, input and output length, and input and output tokens.
  • Tags: business context such as plan, model, and country (see Enrichment and tagging), plus the interaction ID.
  • RAG sources: the sources retrieved to generate the answer, shown as the query sent and the result returned for each source.
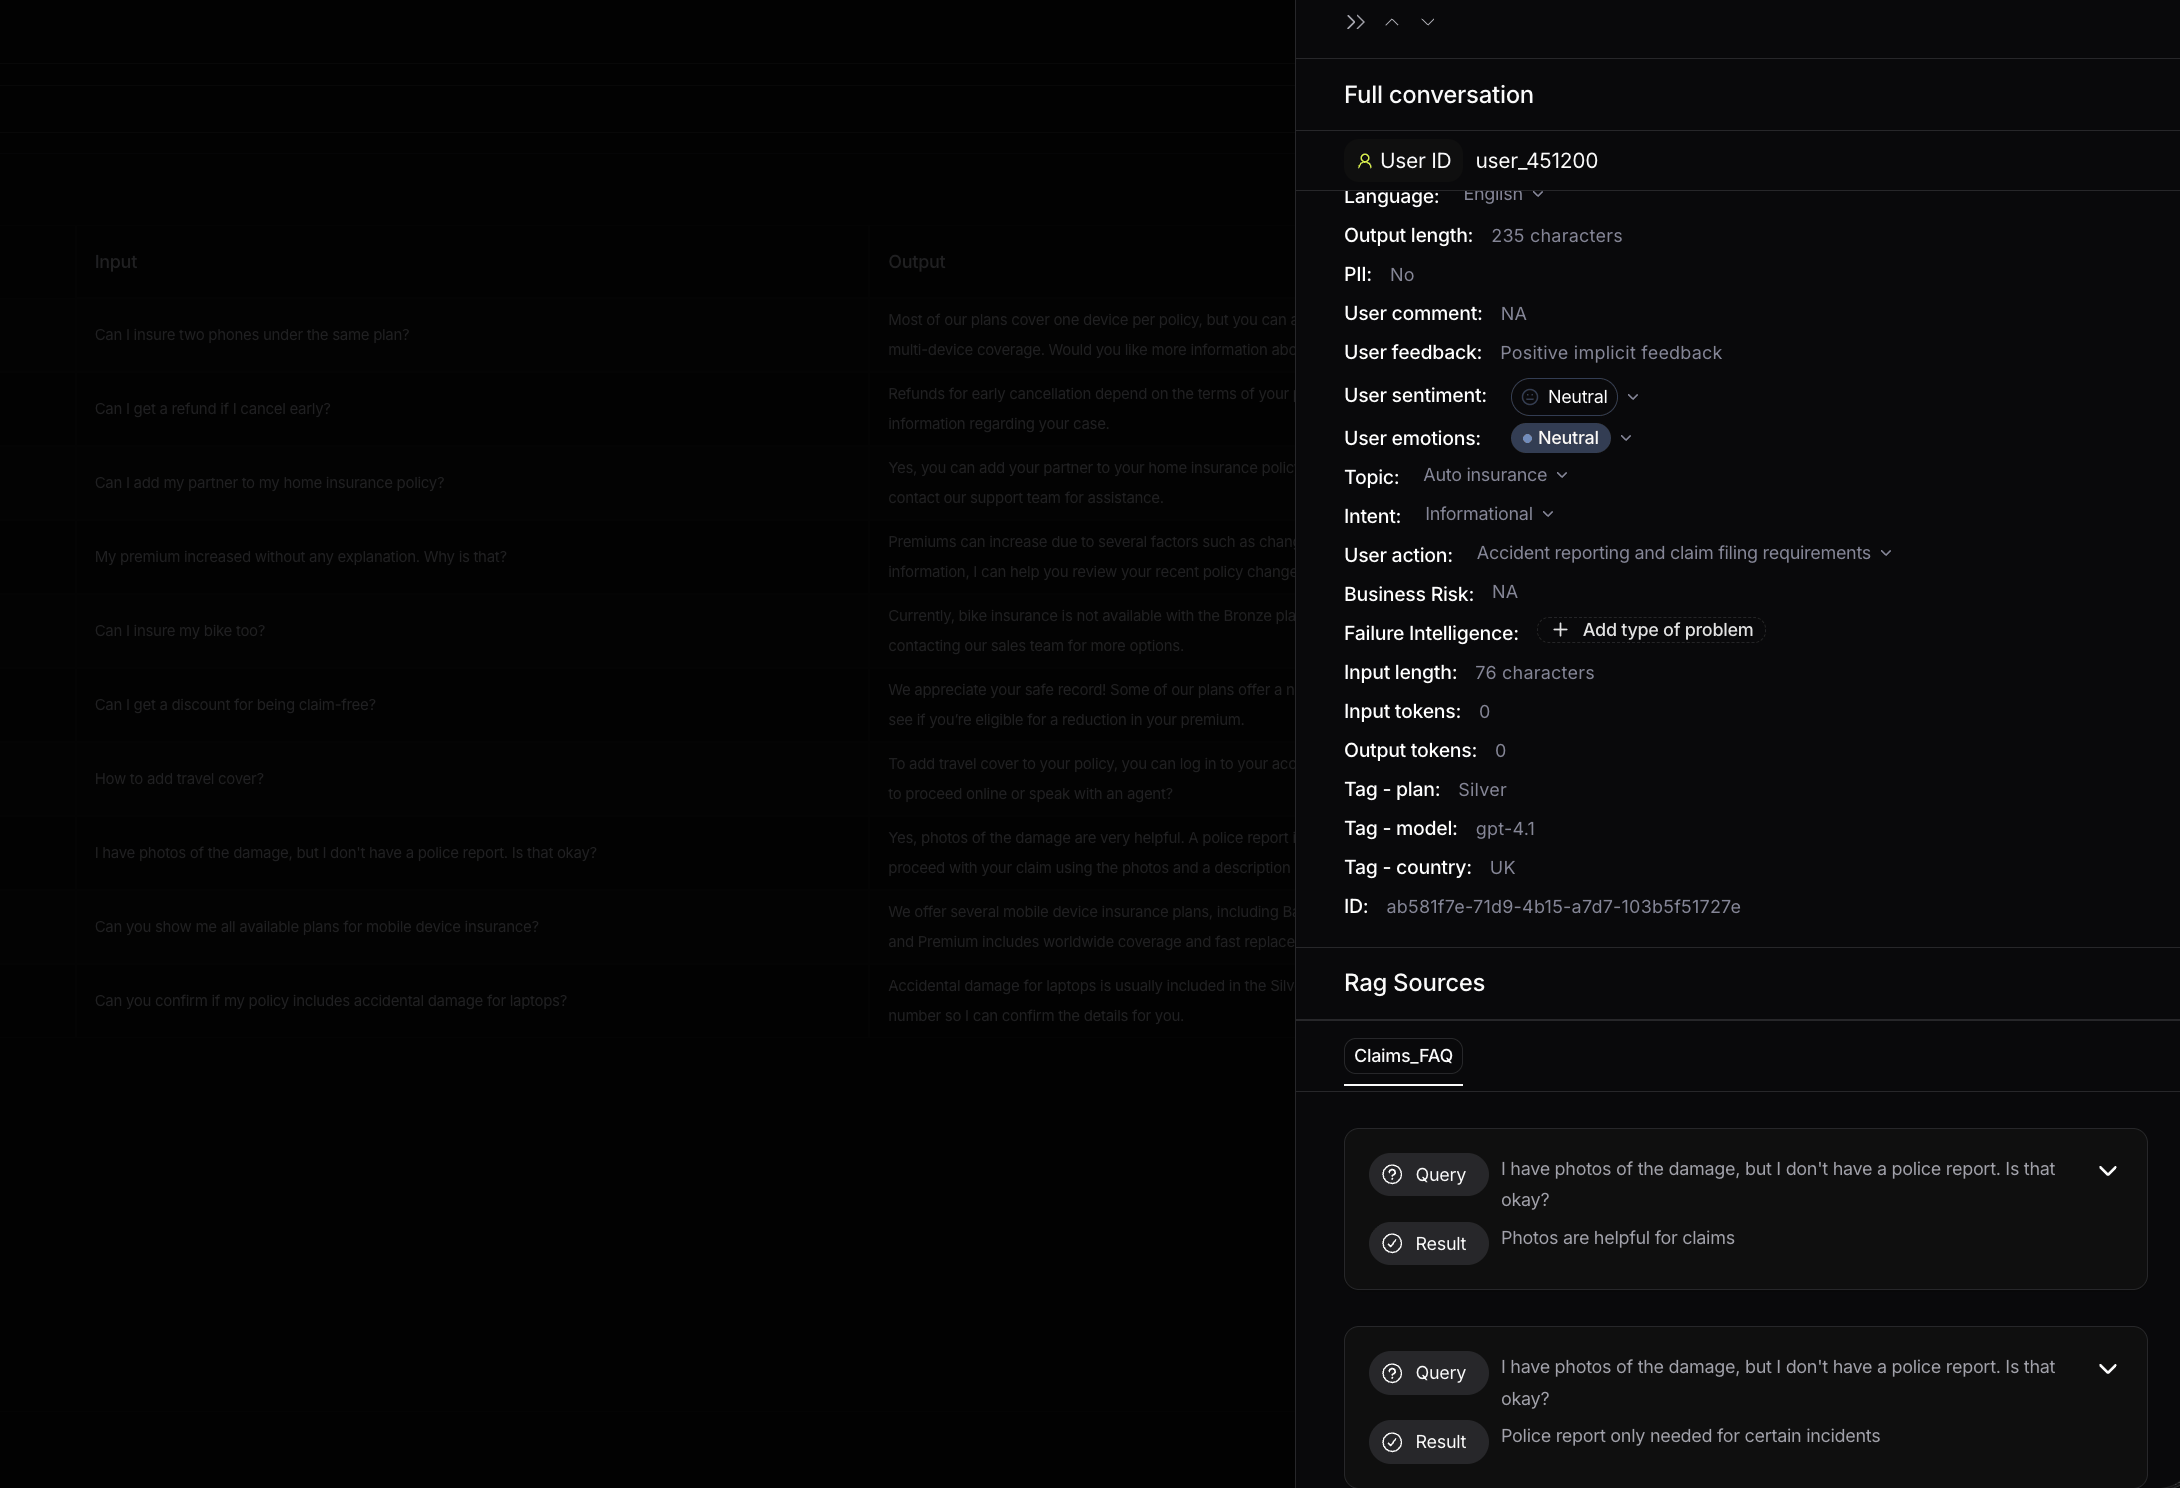
Expanded interaction properties and RAG sources

Expanded properties and RAG sources in the interaction view

Actions

Summarize

The Summarize button generates an AI summary of all the interactions shown in the current view. Instead of reading each interaction one by one, you get an overview of what users are doing and the common problems behind the interactions on screen, which is a fast way to understand a topic, a filtered slice, or any group you are investigating. It works on any table or list view. The button needs at least 5 interactions in the view to generate a summary, so narrow your filters until you have enough data.
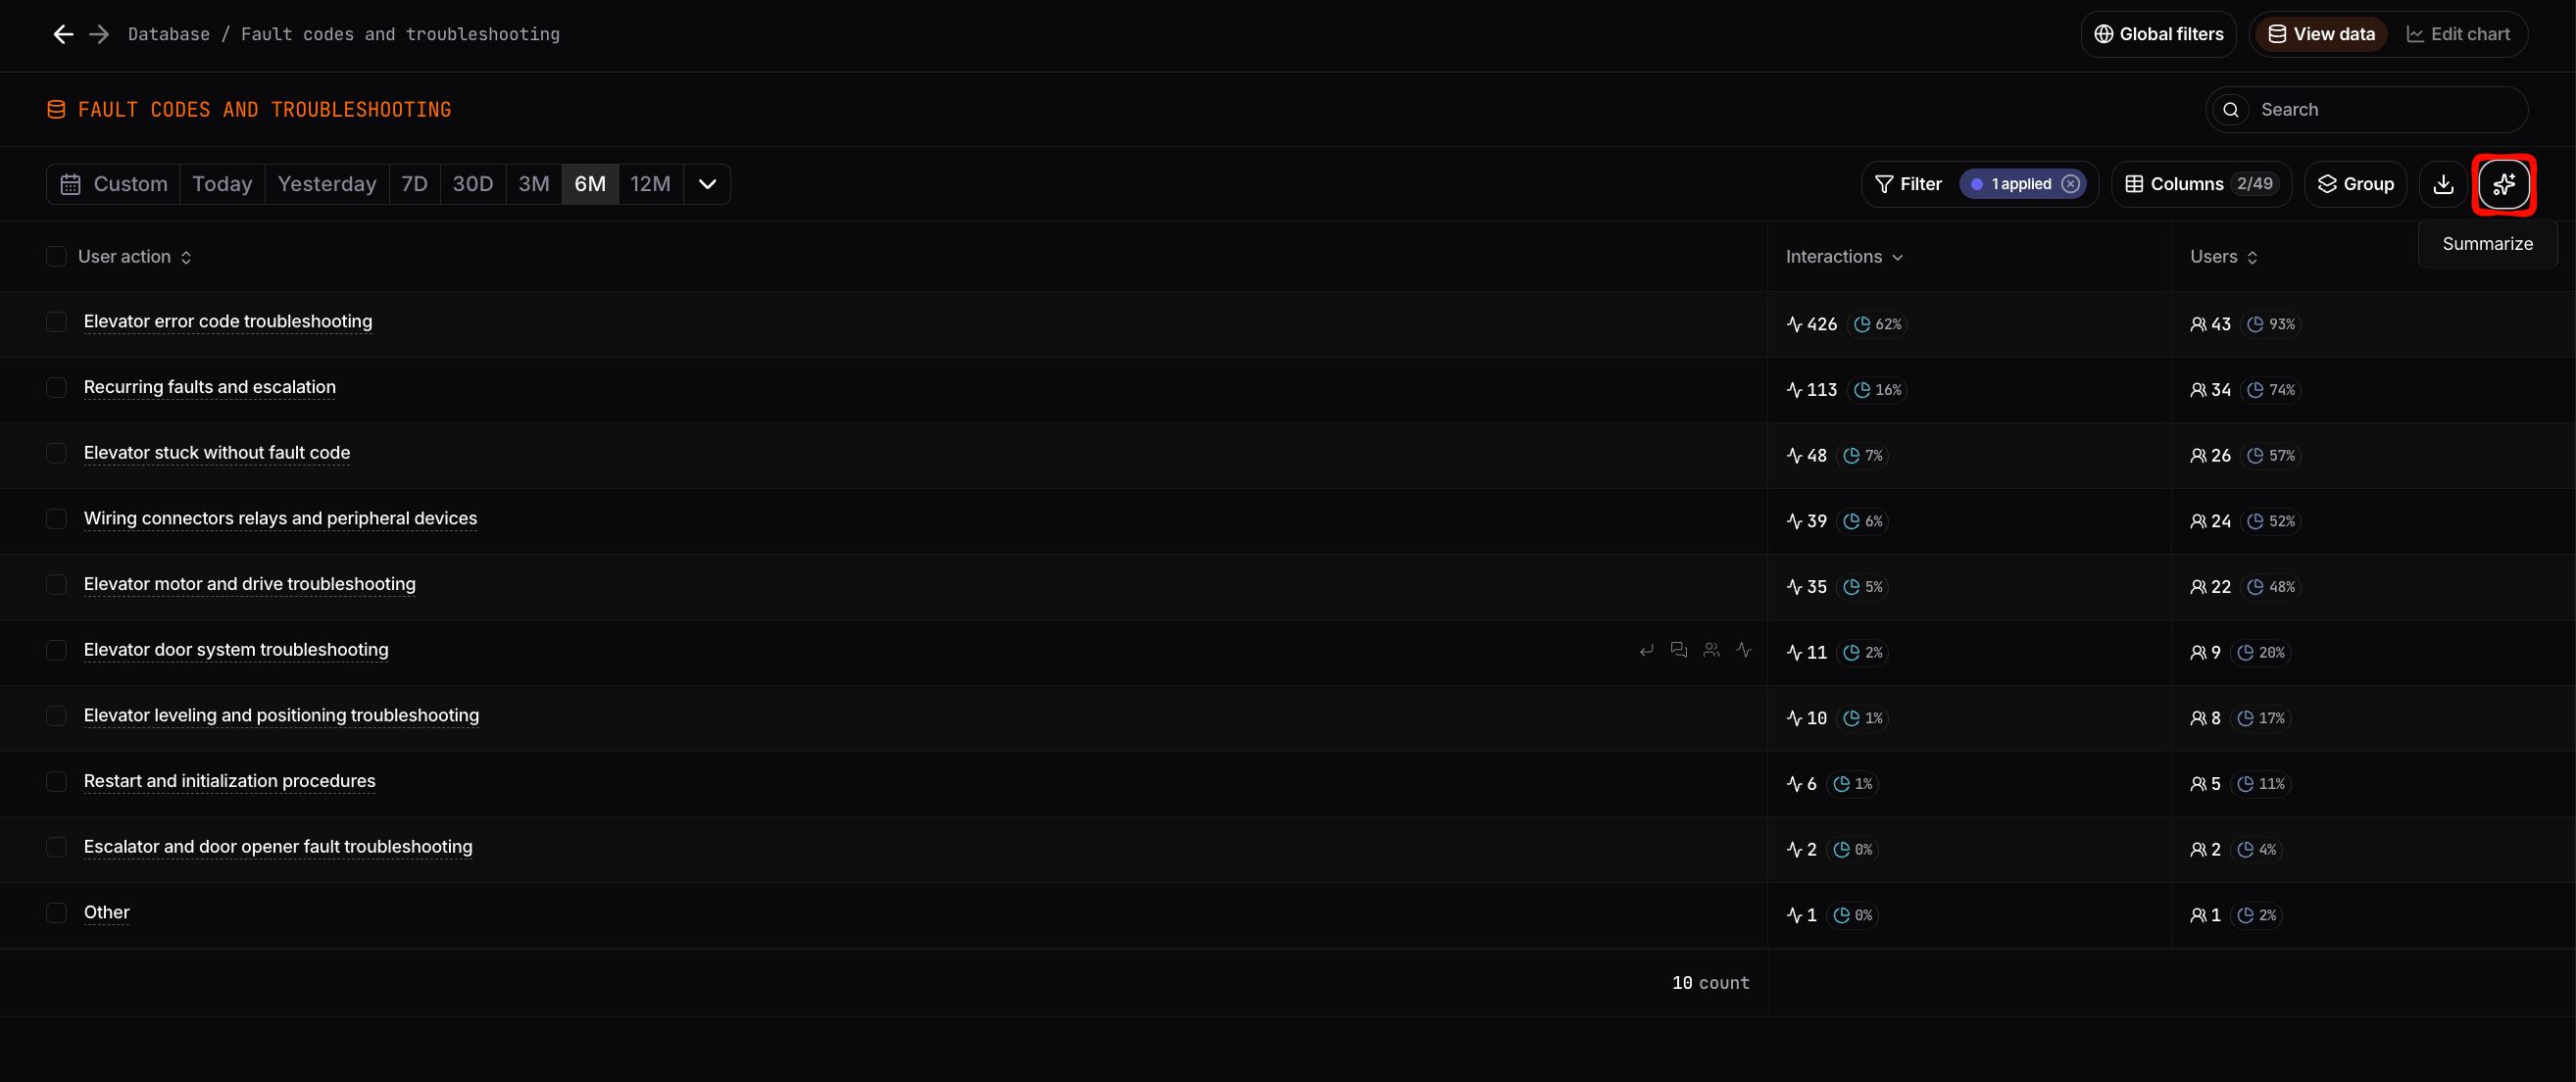
Summarize button in a Live Data table view

The Summarize button in a table view

Manage Interactions

Select one or more interactions to perform bulk actions directly from the table.

Image

Move interactions

Use Move to to reassign one or more interactions to an existing taxonomy group. After selecting the interactions, choose Move to from the action bar. In the dialog, select the Taxonomy Group (for example, Topic) and choose the destination taxonomy class from the list. You can use the search bar to quickly find an existing aggregate. Once confirmed, the selected interactions are moved to the chosen taxonomy class, updating their classification without modifying the original conversation or interaction data. This is useful when interactions have been assigned to the wrong topic or need to be reorganized after reviewing the data. Read more about taxonomy here.

Create a new Topic (Taxonomy Group)

Use Create Topic to create a new taxonomy group and immediately assign the selected interactions to it. After selecting one or more interactions, choose Create Topic from the action bar. Enter a Name for the topic and provide a Description explaining the types of interactions it should contain. If you’re unsure how to describe the topic, click Generate with AI to automatically generate a description based on the selected interactions. When you click Create, Nebuly creates the new taxonomy group and assigns the selected interactions to it. When you click Create, Nebuly creates the new taxonomy group and assigns the selected interactions to it.

Create a new User Action (Taxonomy Class)

Use Create User Action to create a new user taxonomy class and assign the selected interactions to it. After selecting one or more interactions, choose Create User Action from the action bar. First, select the Parent Topic (the related taxonomy group) that the user action belongs to. Then, enter a Name and an optional Description explaining the user action. If needed, click Generate with AI to automatically generate a description based on the selected interactions. When you click Create, Nebuly creates the new taxonomy class under the selected taxonomy group and assigns the selected interactions to it. User actions help organize interactions into more specific categories within a taxonomy group, making it easier to analyze recurring user goals and behaviors.

Add a label

Apply one or more labels to the selected interactions, making them easier to categorize, filter, and analyze later.

Customize the table

Click Edit Table to choose which fields are displayed in the table. You can add or remove columns to focus on the user properties and metrics most relevant to your analysis. Read here to learn more about how to customize table columns and charts.

Filter and time range

Use Filter and the time range selector to narrow the conversations shown in the table. These controls work the same way across Live Data pages. For details, read here.

Export to CSV

Use Export CSV to download the interactions currently displayed in the table. The exported file includes all interactions that match your current filters, search query, and table configuration. If you’ve customized the visible columns, those columns are reflected in the exported CSV.